Market Bias
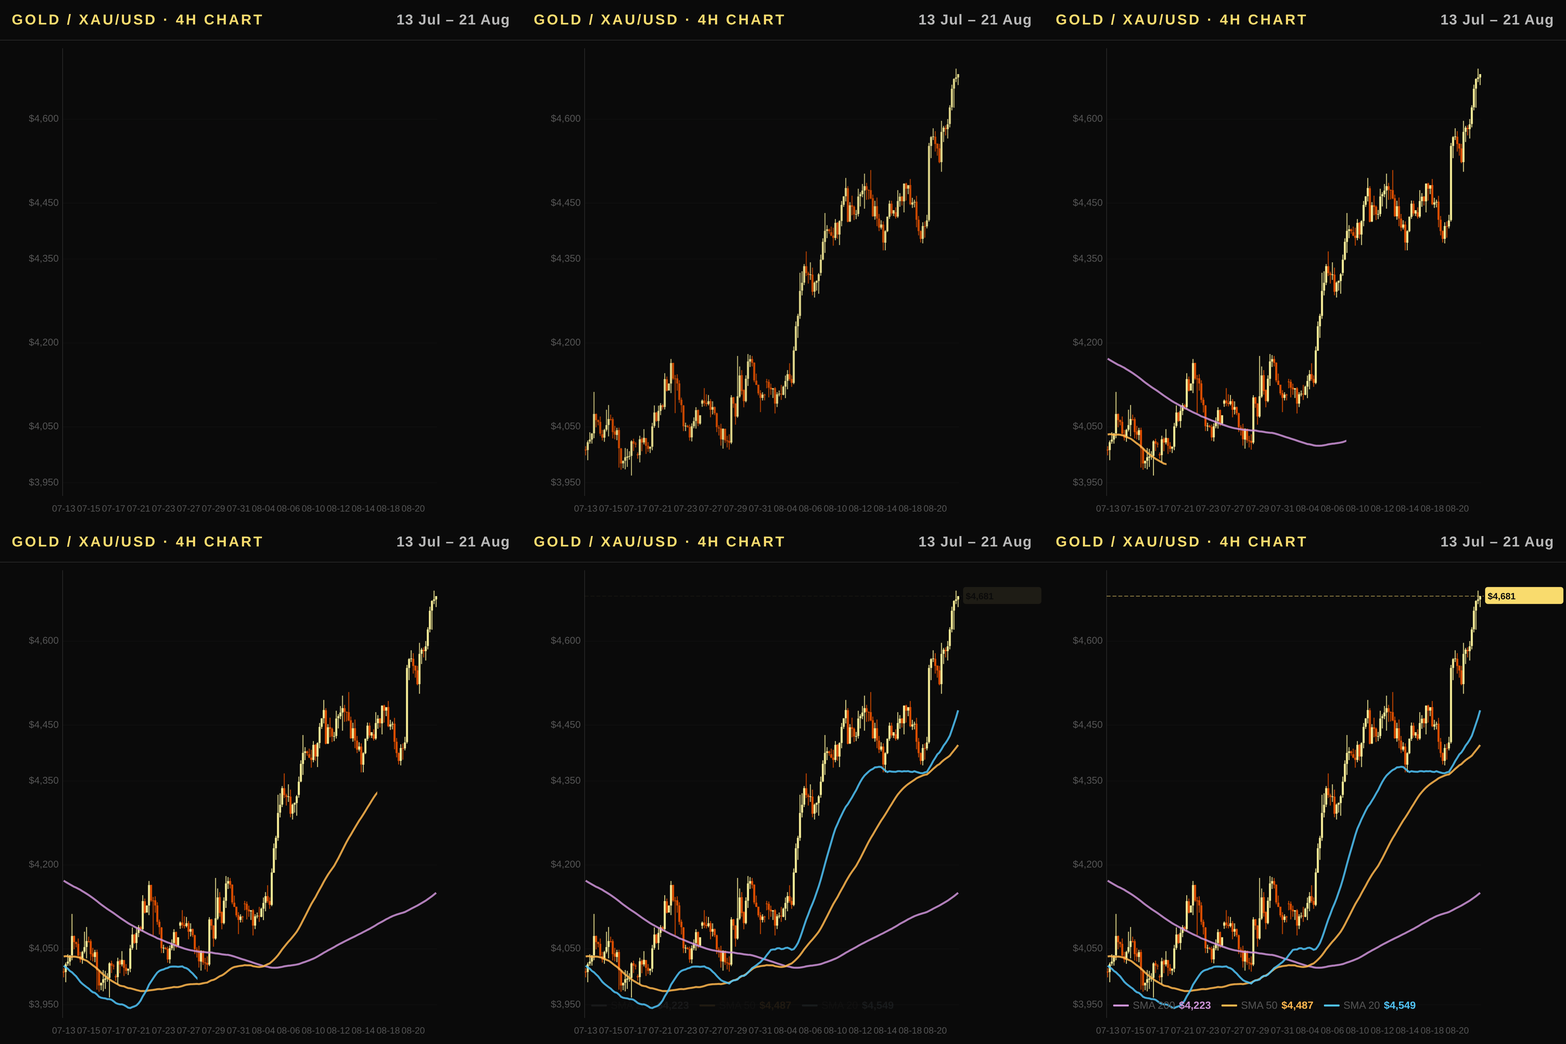
Bullish — The strong uptrend is confirmed by price trading well above all major moving averages, with a robust RSI at 73.8 indicating sustained momentum. With the dollar softening and real yields holding steady, geopolitical tensions and aggressive central bank accumulation continue to provide a powerful structural tailwind for spot gold prices.
Executive Summary
Gold price today (XAU/USD) stands at $4,624.1, supported by a strong uptrend with significant momentum over the past week (+5.56%) and month (+14.27%). The gold price forecast points to continued strength as rising geopolitical risks and structural central bank demand provide a solid foundation for spot gold price appreciation. While ETF flows show a healthy net inflow of $2.97 billion this month, investors should monitor real rates and dollar dynamics that could impact the trajectory. Overall, the technical structure remains robust with the current price trading above key moving averages, validating the bullish thesis despite broader market volatility.
Global Outlook: Fed Policy, Real Rates, and Gold's Safe-Haven Premium
- Fed policy trajectory: The Federal Reserve maintains a federal funds rate of 3.63% while market expectations for further cuts remain muted given persistent inflation data. With the US 10Y Treasury yield at 4.6%, nominal bond prices offer competitive returns, yet gold benefits from the structural support provided by central bank demand and geopolitical uncertainty.
- Real rates and gold: The 10Y Real Rate (TIPS) sits steady at 2.35%, indicating that opportunity costs for holding this non-yielding asset are currently balanced. A decline in real rates would reduce the cost of holding gold, whereas a rise would exert downward pressure on prices; currently, the stable TIPS figure supports the ongoing gold price today rally without significant headwinds from bond yields.
- Dollar impact: The US Dollar Index (DXY) has weakened by 2.59% over the month to 98.8, lowering the effective cost of gold for international buyers and boosting global demand. This divergence between a weakening DXY and rising gold prices is a classic tailwind for the gold price forecast.
- Federal Reserve forward guidance: Recent FOMC statements suggest the central bank will remain data-dependent, preventing aggressive hiking cycles that would spike real rates. This dovish stance on future rate hikes acts as a bullish catalyst, encouraging investors to rotate into precious metals ahead of the upcoming US Gross Domestic Product release.
Technical Analysis
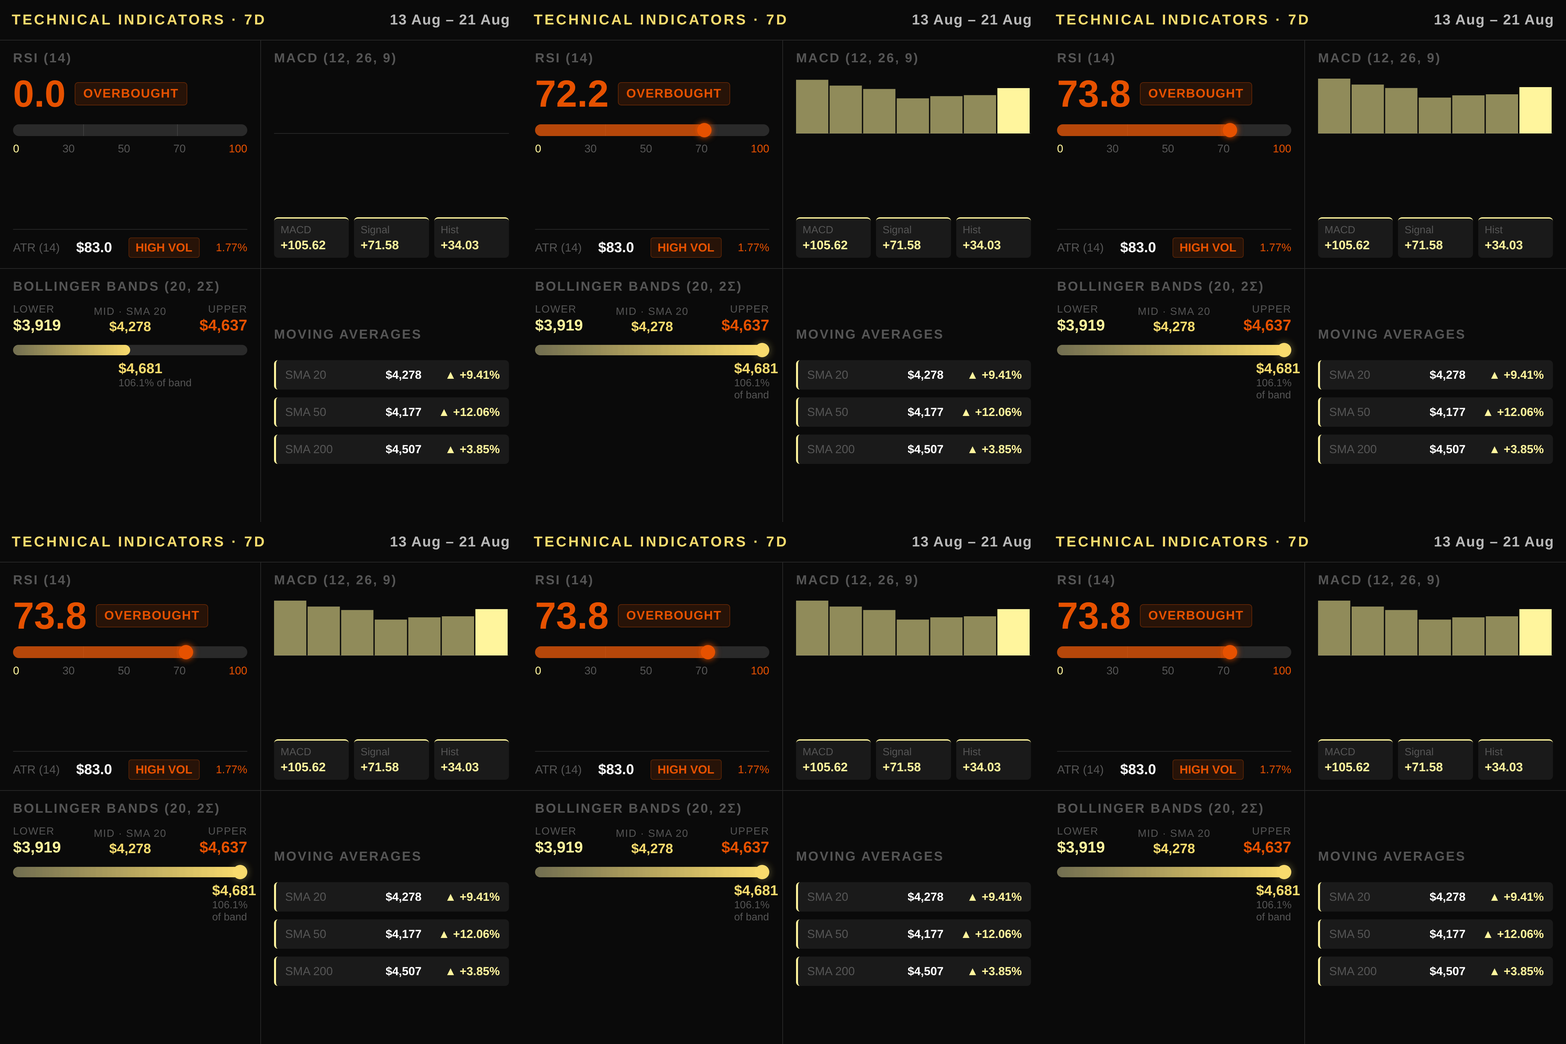
Gold is trading at $4624.1, a level that aligns with the 60-day resistance mark, while holding firmly above the SMA 50 ($4177.0) and SMA 20 ($4278.2). The RSI sits at 73.8, indicating strong bullish momentum that is approaching overbought territory without yet showing signs of a significant pullback. The MACD histogram value of 34.03 confirms sustained upward pressure as the MACD line stays well above the signal line. Bollinger Bands frame the current volatility with an upper band at $4637.0 and a lower band at $3919.3, placing the spot price near the ceiling which suggests potential for a short-term consolidation or a test of the immediate resistance zone. The ATR of 83.0 highlights elevated daily volatility, consistent with the asset’s strong uptrend over the past month. Immediate support sits at the SMA 200 ($4507.0), with deeper support at the SMA 20 ($4278.2), while the next major hurdle lies at the 52-week high of $5586.2, which remains untested in the current cycle.
Macroeconomic Factors
The Federal Reserve maintains its policy rate at 3.63%, while the US Gross Domestic Product grew by 2.2% in 2025, providing a stable backdrop for asset pricing. The critical driver for XAU/USD remains real interest rates, currently anchored at 2.35% as measured by the 10Y Real Rate (TIPS), which directly dictates the opportunity cost of holding non-yielding gold. A static TIPS yield implies steady headwinds on the upside, as rising real rates increase the relative attractiveness of fixed-income assets over bullion. The US Consumer Price Index stands at 3.54% year-over-year, indicating that inflation is moderating but remains above the Fed’s long-term target. Meanwhile, the 10Y Treasury yield has risen to 4.6%, reflecting nominal bond market dynamics rather than the real return environment that governs gold valuation. The US Dollar Index (DXY) has weakened by 2.59% over the past month, reducing the effective price of gold for international buyers and supporting global demand from emerging markets. This divergence between a softening dollar and resilient domestic data creates a nuanced environment where safe-haven flows can emerge despite higher real yields. Geopolitical tensions continue to provide an underlying risk premium, reinforcing gold’s role as a portfolio hedge during periods of market uncertainty or external shocks.
Positioning and Market Flows
COT data from the latest report dated August 18 shows speculative positioning in gold futures remains robustly bullish, with non-commercial net longs climbing to 222,189 contracts. This increase of 38,279 contracts over the past week reflects strong institutional confidence in the metal’s continued upside potential within the current uptrend.
In contrast to the bullish futures positioning, ETF flows present a mixed signal. Monthly data indicates a net inflow of approximately $2.97 billion into gold-backed exchange-traded funds, suggesting that investors are allocating capital toward physical exposure via these vehicles despite broader market volatility. The positive flow direction underscores sustained institutional demand for gold as a store of value, reinforcing the metal’s appeal even when equity markets fluctuate.
Central bank demand continues to provide structural support for spot gold prices over the longer term. While specific weekly purchase figures are not provided in this snapshot, ongoing accumulation by global central banks—particularly from emerging market economies seeking diversification away from USD-dominated reserves—has created a persistent floor beneath the price. This multi-year buying program acts as a stabilizing force, offsetting short-term speculative swings and providing downside protection during periods of heightened uncertainty.
Correlated Assets
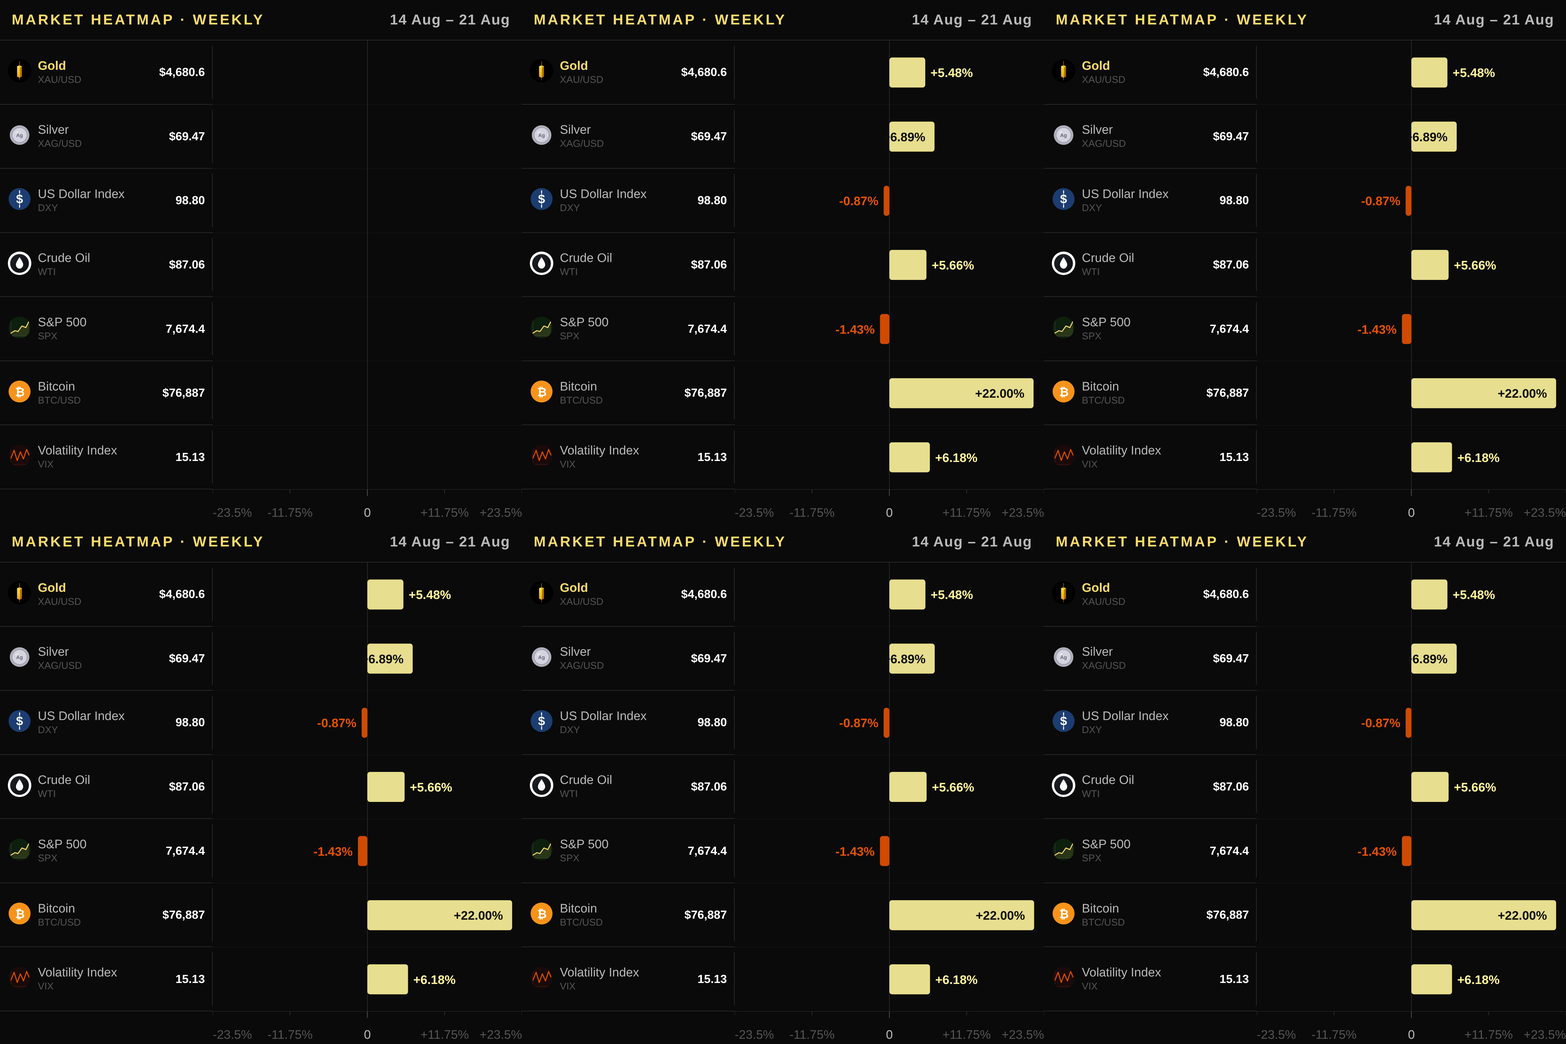
Gold's inverse correlation with the US Dollar Index (DXY) remains intact, with the dollar down 0.87% this week at 98.8, lowering gold's effective price for non-US buyers and supporting global demand. The US 10Y Treasury yield sits at 4.738%, up 0.89% on the week; while higher nominal yields are typically bearish, the real rate of 2.35% (TIPS) is stable, keeping the opportunity cost of holding non-yielding gold contained rather than rising sharply. Silver has rallied 6.89% this week to $69.47, outpacing gold in its technical recovery following broader market volatility. WTI crude oil advanced 5.66% to $87.06 per barrel, reinforcing geopolitical risk premiums that underpin gold's safe-haven status despite recent price corrections. Copper rose 4.35% month-over-month to $6.58/lb, indicating persistent industrial demand despite weekly weakness, suggesting a commodity super-cycle backdrop beneficial for precious metals. The S&P 500 fell 1.43% this week but remains within its long-term uptrend at 7674.37, limiting broad risk-off flows that would otherwise pressure gold excessively. The VIX climbed 6.18% to 15.13, reflecting rising uncertainty from Middle East tensions and trade disputes, which typically trigger safe-haven buying into gold rather than equities. Bitcoin surged 19.19% this week to $76,887, demonstrating its role as a high-beta risk asset that diverged sharply from traditional safe havens during recent geopolitical shocks. This divergence highlights gold's unique status: while Bitcoin attracts speculative capital during periods of extreme volatility, gold absorbs sustained safe-haven flows driven by currency debasement fears and central bank policy uncertainty.
Upcoming Catalysts
- US Gross Domestic Product — 2026-08-26: A revised print could alter market expectations for Fed rate path and influence gold's safe-haven appeal.
- US Non-Farm Payrolls — 2026-09-04: Strong employment data may support the dollar, while a weaker report could boost real yield growth and weigh on prices.
- US Producer Price Index — 2026-09-10: Rising wholesale inflation signals persistent cost pressures that might keep core CPI elevated for longer.
- US Consumer Price Index — 2026-09-11: The headline inflation figure is the primary driver of Fed policy and remains the most watched indicator for gold price direction.
Trading Idea
Given the strong uptrend and bullish technicals, investors should consider a long position on XAU/USD with an entry zone between $4600 and $4650. A stop loss should be placed at $4500 to protect capital in case price action breaks below the recent consolidation support near the SMA 200. The primary target is set at $4750, which represents a logical extension of the current rally given the strong momentum and positive MACD histogram. US investors can execute this trade by purchasing shares of SPDR Gold Shares (GLD) or iShares Gold Trust (IAU) on US exchanges, trading COMEX gold futures, or buying physical bullion from authorized US dealers.
Price Outlook and FAQ
Gold is expected to trade between $4,485 and $4,763 tomorrow, a range bracketing the current spot level with volatility supported by the 14-day ATR. The one-week directional bias remains bullish as price action continues to consolidate near the upper Bollinger Band while waiting for macro catalysts to confirm further upside momentum toward the 60-day high at $4,624.1.
Is gold currently a reliable inflation hedge for US investors given the latest CPI data? Yes, gold remains an effective inflation hedge for US investors, particularly as the annualized CPI sits at 3.54%, which outpaces the Federal Reserve's policy rate and erodes purchasing power. However, the relationship is nuanced because real interest rates, currently at 2.35% via TIPS yields, impose an opportunity cost that can temporarily suppress gold prices even when headline inflation remains elevated. Investors should view gold as a long-term store of value rather than a short-term tactical trade against CPI prints alone.
How do Federal Reserve rate decisions and real rates specifically impact spot gold prices? Fed rate decisions influence gold primarily by shifting the 10Y Real Rate (TIPS), which dictates the opportunity cost of holding this non-yielding asset. When real rates rise, as seen recently with the 10Y Treasury yield climbing to 4.6%, gold typically faces headwinds because bond yields become more attractive; conversely, falling real rates reduce that cost and fuel bullish momentum for XAU/USD. The market currently watches the Fed Funds Rate at 3.63% closely, anticipating future cuts that would lower inflation expectations and support higher asset prices.
What are the primary ways US investors can purchase physical or digital gold today? US investors can gain instant exposure to spot gold through exchange-traded funds like SPDR Gold Shares (GLD) and iShares Gold Trust (IAU), which trade on the NYSE with high liquidity and low minimums. For those preferring physical ownership, reputable dealers such as APMEX, JM Bullion, and the US Mint offer sovereign bullion and coins that can be stored in private or insured vault facilities. Additionally, active traders may utilize COMEX gold futures for leveraged exposure without the logistical complexities of holding physical bars.
This article is for informational purposes only and does not constitute investment advice or a financial recommendation. Investing in financial assets involves risk.
Key Takeaways for Traders
-
Current Market Stance: The market remains in a strong uptrend with XAU/USD trading well above all major moving averages, and traders should look for long entries on pullbacks toward the SMA 20 at USD 4,278.2, provided the price holds above this support level.
-
Key Technical Level: Watch for the immediate resistance zone near the 60-day high of USD 4,624.1; a decisive break above this level could trigger momentum toward the next psychological barrier, while a rejection would likely see a test of the SMA 50 at USD 4,177.0.
-
Main Macro Driver: Monitor the trajectory of real interest rates as measured by the 10Y Real Rate (TIPS) at 2.35%; any decline in this figure would reduce the opportunity cost of holding gold and act as a powerful bullish tailwind for the spot price.
-
Key Flow Signal: Institutional demand remains robust with significant net ETF inflows of approximately USD 2.97 billion in the most recent month, confirming that structural buying pressure outweighs short-term speculative volatility.
-
Main Risk Consideration: The primary risk to the bullish thesis is a sharp reversal in real yields or an unexpected surge in the US Dollar Index (DXY), which would immediately increase the effective cost of gold for global buyers and could invalidate the current uptrend structure.

