Gold Trading (XAU/USD): Bearish — Spot Gold Trades Below All Key Averages
Market Bias
Bearish
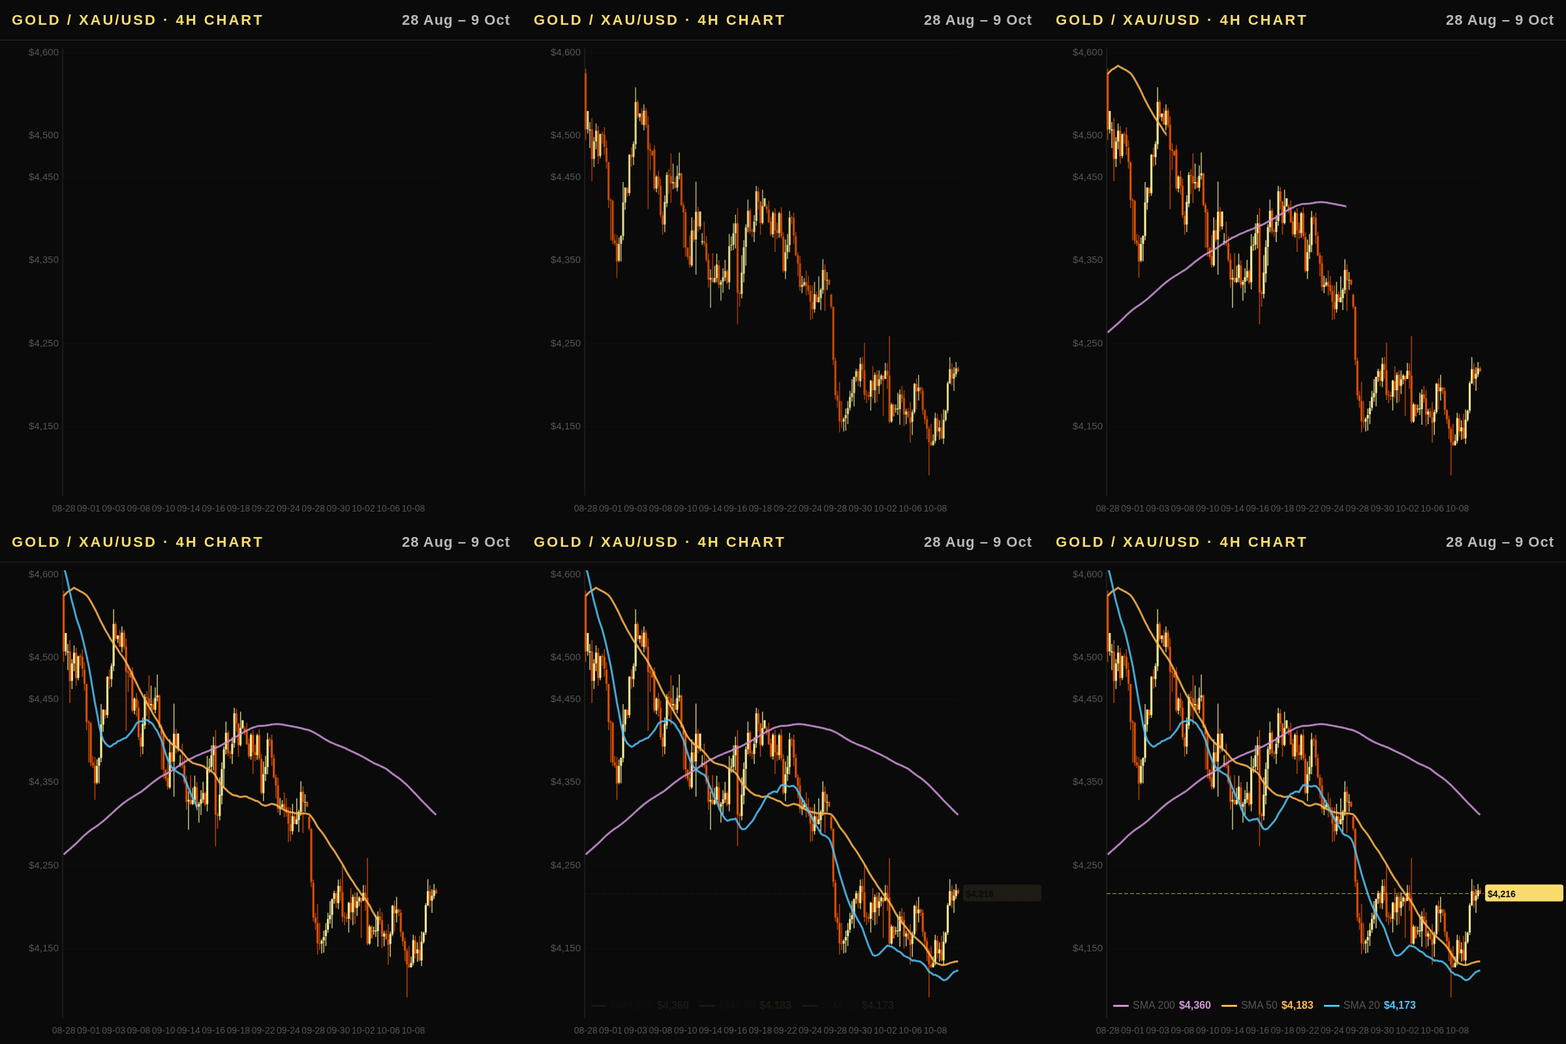
Gold is trading at USD 4,216.3, below the SMA 20 (4,278.0), below the SMA 50 (4,357.6) and below the SMA 200 (4,529.2), so all three averages now act as overhead resistance. RSI(14) at 43.8 sits below the neutral level of 50 but is not oversold, and the MACD line (-57.86) remains under its signal line (-47.49), while the histogram (-10.37) confirms that downside momentum is still present. The one-week gain of 1.30% is a corrective bounce inside a strong downtrend, and the one-month decline of -3.40% shows that the broader structure remains weak. A sustained reclaim of the SMA 20 (4,278.0) would be the first warning that the bearish stance is losing ground, and a close above the SMA 50 (4,357.6) would confirm that it has ended.
Executive Summary
Gold remains under pressure, with spot gold trading at USD 4,216.3 and sitting below all three of its key moving averages: the SMA 20 at USD 4,278.0, the SMA 50 at USD 4,357.6 and the SMA 200 at USD 4,529.2. The 1-month decline of -3.40% and the 52-week high of USD 5,586.2 underline how far the metal has fallen from its recent peak, with the 52-week high serving as historical context only. Firm US yields and a US Dollar Index (DXY) at 102.21 keep the spot gold price under pressure, although the 1-week gain of 1.30% and a net ETF inflow of USD +9.95 billion show that dip buyers are still active. Until spot gold reclaims the SMA 20, the bearish stance remains in place.
Global Outlook: Fed Policy, Real Rates and the Dollar
- Fed policy trajectory: The Federal Reserve policy rate stands at 3.75% in a hiking stance as of 2026-09-01. The latest FOMC guidance points to higher rates being expected, which keeps the policy path a headwind for gold over the next one to three months.
- Real rates: The 10Y real rate (TIPS) is 2.87%, with a change of -0.05 percentage points on the week. Falling real rates lower the opportunity cost of holding non-yielding gold, which is a modest tailwind, but the level remains high by recent standards and does not offset the rate-hike backdrop.
- The dollar: The US Dollar Index (DXY) is at 102.21, up 0.27% on the week and up 3.12% on the month. A stronger dollar makes gold more expensive for buyers outside the United States and pressures the price, so the dollar's firmness is a bearish factor for gold.
- Gold in CAD and AUD: Gold rose 1.33% in Canadian dollar terms over the week, against 1.30% in USD, while the CAD per USD 7-day change of +0.03% shows a slight loss of local-currency strength. Over the month, gold fell 0.27% in CAD against -3.40% in USD, and in AUD it rose 0.86% on the week against 1.30% in USD and fell 0.17% on the month against -3.40% in USD. A weaker local currency lifts gold's local-currency price, so the Canadian and Australian readings are less negative than the USD move.
Technical Analysis
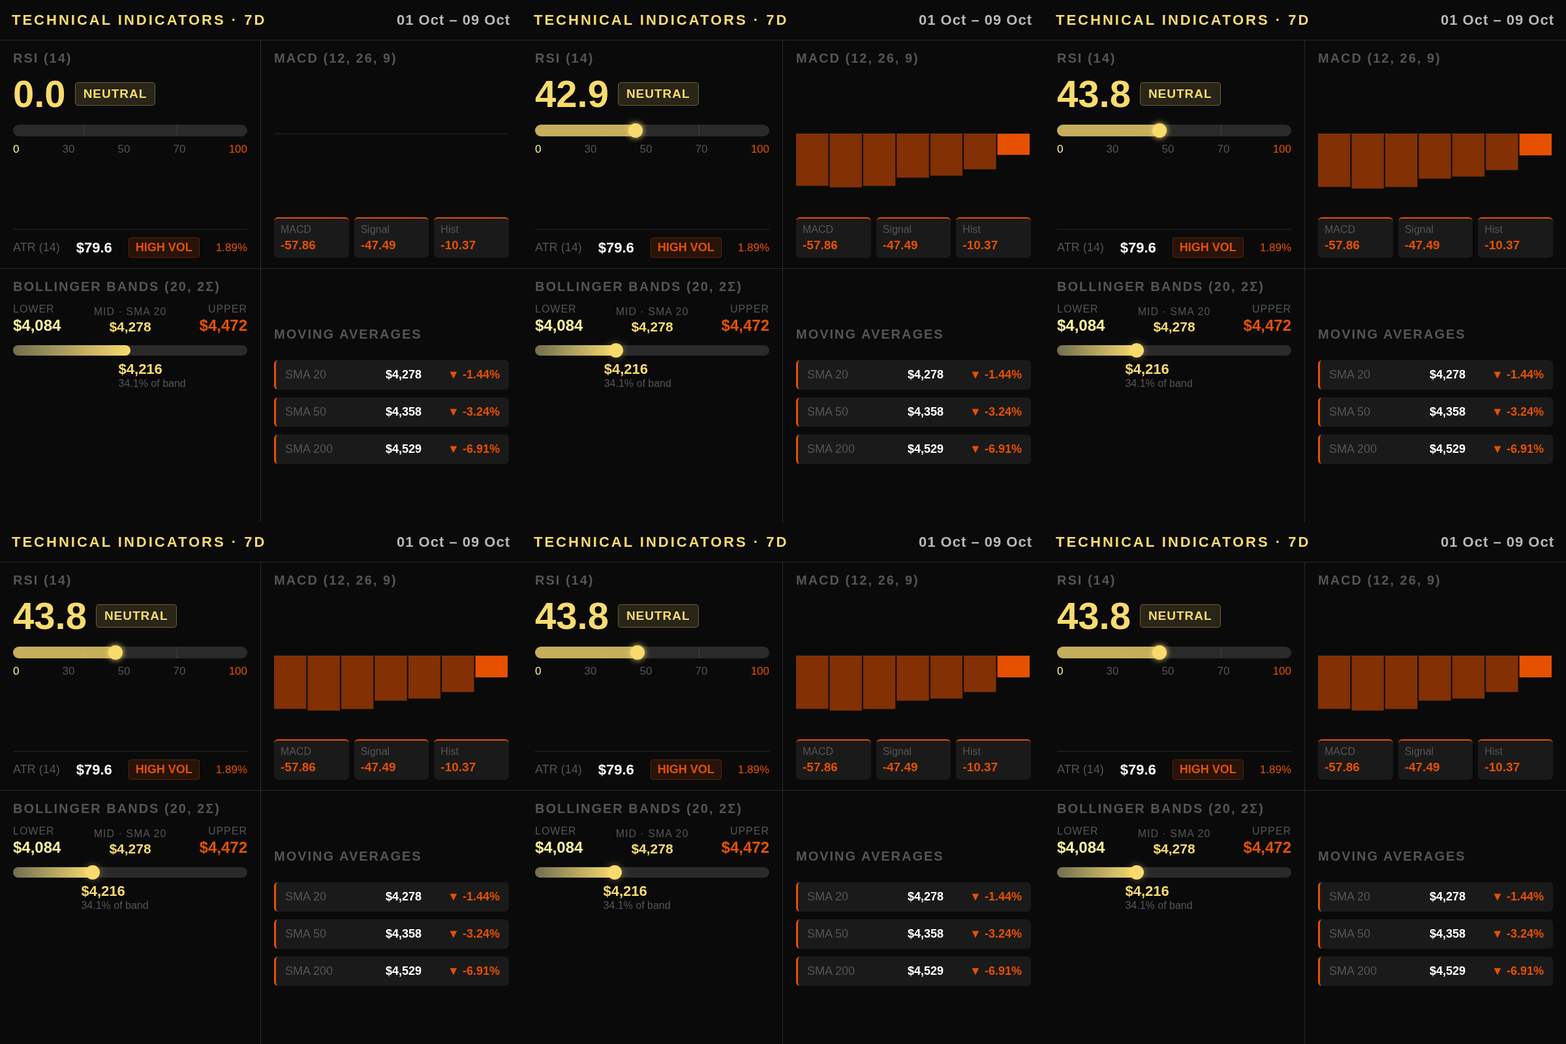
Gold is trading in a bearish structure, with spot at $4,216.3 sitting below all three of its key moving averages. The 1-week change of +1.30% is a modest bounce, but the 1-month change of -3.40% and the strong downtrend classification confirm that the broader trend still points lower.
- SMA 20: spot is below the SMA 20 at $4,278.0, so this average is overhead resistance rather than support.
- SMA 50: spot is below the SMA 50 at $4,357.6, which also acts as resistance.
- SMA 200: spot is below the SMA 200 at $4,529.2, the most distant overhead level and a key long-term resistance marker.
RSI (14) stands at 43.8, below the neutral level of 50 and firmly in bearish territory, but not oversold because it remains above 30. This reading gives no sign of exhaustion yet.
MACD is at -57.86, with the signal line at -47.49 and the histogram at -10.37. The MACD line sits below its signal line, so the bearish crossover has already occurred. The negative histogram confirms that downside momentum is still building.
Bollinger Bands (20-period, 2 standard deviations) show the upper band at $4,472.4, the middle band at $4,278.0, and the lower band at $4,083.7. Spot sits in the lower half of the band structure, with the middle band acting as resistance overhead and the lower band as the nearest support below.
ATR (14) is 79.6, so gold typically moves about USD 80 in a day.
Key levels in USD: The 60-day high at $4,670.9 is the resistance still to be tested from above, while the 60-day low at $3,999.7 is the support level still to be tested from above on any further decline. The 52-week low at $3,913.7 lies further below as a longer-term reference.
Gold Levels in Local Currencies
Reference values at today's spot price and exchange rates, before dealer premiums and taxes:
| Market | Currency | Spot (1 oz) | Support | Resistance | 1 g (24K) |
|---|---|---|---|---|---|
| United States | USD | 4,216 | 4,000 | 4,671 | 135.56 |
| Canada | CAD | 6,011 | 5,702 | 6,659 | 193.24 |
| Australia | AUD | 6,036 | 5,725 | 6,686 | 194.05 |
Macroeconomic Factors
-
Fed trajectory: The Fed Funds Rate stands at 3.75%, up 0.12 percentage points from the prior reading and below the 4.22% level of a year ago. Recent Fed commentary signals that higher rates are expected, so the next one to three months point to a restrictive policy path rather than the easing seen last year.
-
Real rates (TIPS): The 10Y real rate is 2.87%, a positive level that fell 0.05 percentage points from the prior reading and sits 0.24 percentage points above its year-ago 2.63%. Falling real rates lower the opportunity cost of holding non-yielding gold, which is a tailwind for the metal. The decline is small, though, and the nominal 10Y yield rose 0.31 percentage points to 4.99%, suggesting the nominal move is being driven by inflation expectations rather than by a genuine easing of real financial conditions.
-
The US Dollar Index (DXY): The US Dollar Index (DXY) is at 102.21, up 0.27% on the week and up 3.12% on the month. A stronger dollar makes gold more expensive for buyers outside the United States and weighs on global demand, so this move is a headwind for the metal.
-
US CPI: The US CPI is running at 3.71% year on year. This is an observed inflation print, not the Federal Reserve's target, and it keeps inflation-hedging demand relevant even as policy tightens.
-
Geopolitical premium: Recent headlines describe modest gold gains tied to "productive discussions" with Iran, which points to little current safe-haven premium in the price.
Taken together, higher policy rates, a firm dollar and rising nominal yields outweigh the modest support from falling real rates, so the macro backdrop remains bearish for gold.
Positioning and Market Flows
COT speculative positioning in gold futures shows non-commercial traders holding a net long of 210,335 contracts as of the 2026-10-06 report, a week-over-week decline of -21,625 contracts. The speculative bias remains labelled BULLISH, but the falling net long means speculators are trimming exposure rather than adding to it. Commercial traders hold a net short of -244,527 contracts, which reflects producer hedging and is a bearish-to-neutral signal rather than an institutional buying signal.
ETF flows recorded a net INFLOW of USD +9.95 billion (approximately +67.3 tonnes) for the 2026-09-01 data month, with total holdings reaching 4,255.7 tonnes. Buying of this scale is a constructive sign for physical demand, yet it is set against a 1-month gold price decline of -3.40%, so the flow data is lagging the price action and does not yet confirm a durable turn higher.
Central bank demand is visible only through reserve holdings as of 2025-12-31, when the top-10 central banks held 21,320.5 tonnes, led by the US at 8,212.9 tonnes. These figures are year-end holdings, and the data provides no recent purchase figures, so they cannot be used to confirm current official-sector buying.
Correlated Assets
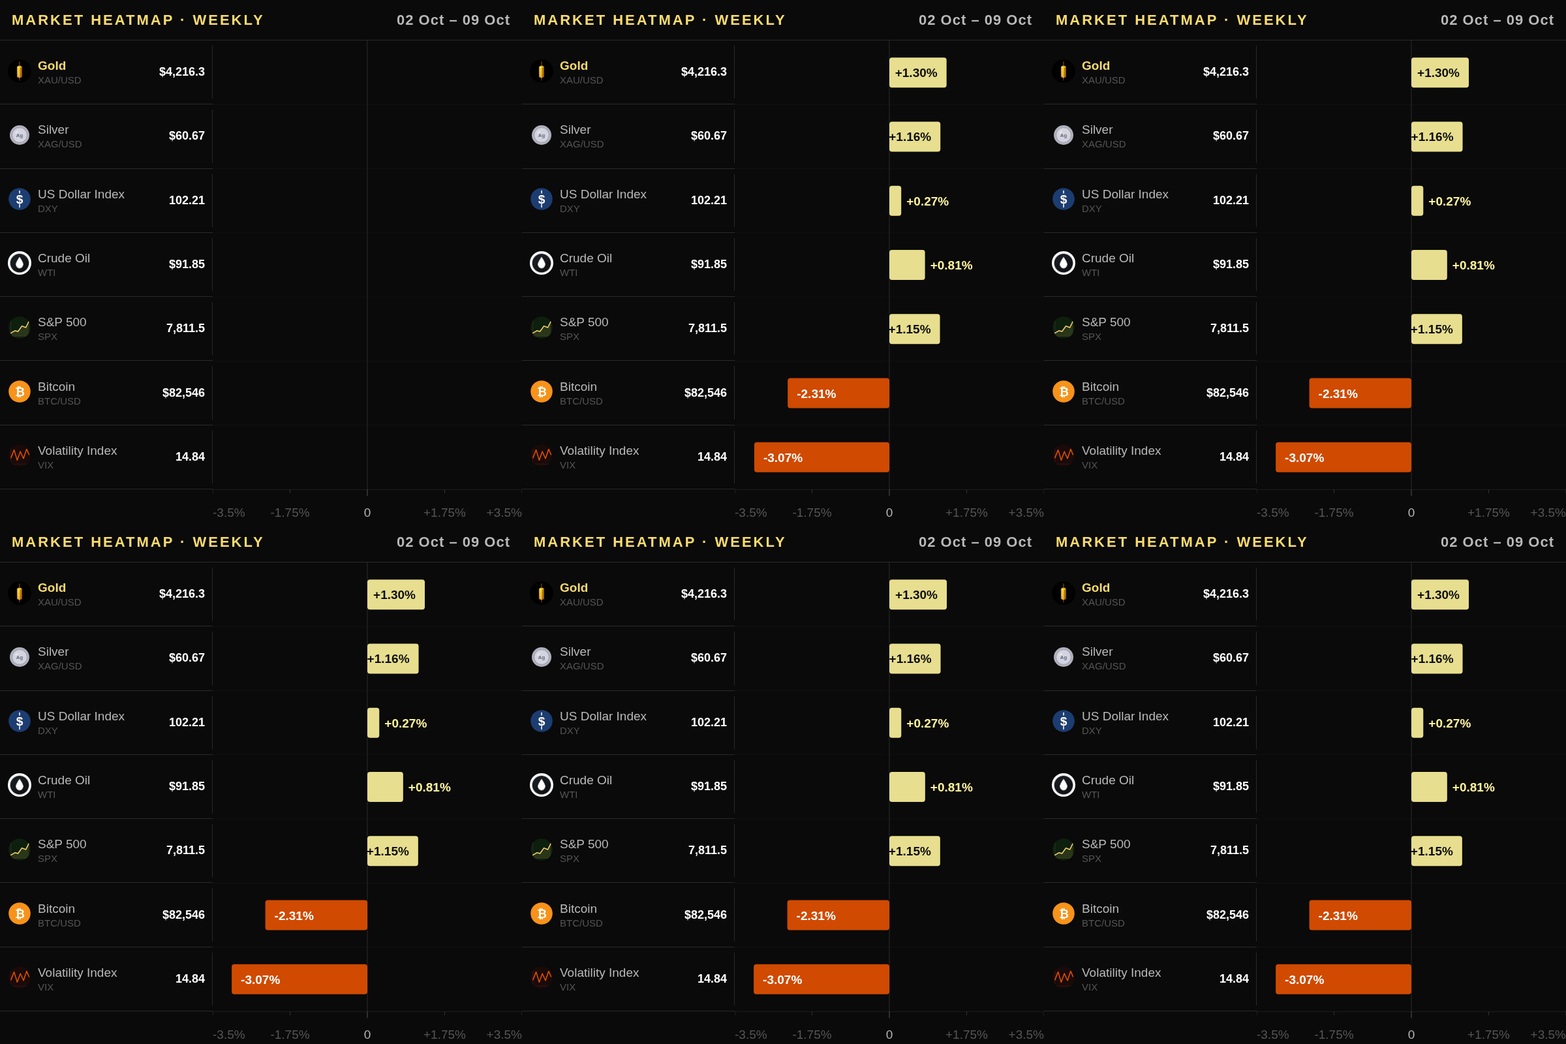
Gold's weekly direction is positive at +1.30%, while its monthly change is -3.40%, so the broader trend remains a correction within a bearish structure. The US Dollar Index (DXY) rose +0.27% on the week and +3.12% on the month, so the dollar has been strengthening over the past month, which pressures gold priced in other currencies. The 10-year US Treasury yield (US10Y) at 5.244% fell -0.63% on the week but rose +6.07% over the month, keeping the yield backdrop a headwind for gold. Silver rose +1.16% this week to 60.67, but it fell -6.02% over the month, so it has lagged gold's longer-term decline and is not moving in lockstep with it.
WTI crude oil rose +0.81% this week to 91.85 and fell -8.20% over the month, so the energy complex remains weak on a monthly basis. Copper strengthened +2.32% on the week to 6.6425 and +2.67% over the month, which signals firmer industrial demand. The S&P 500 (SPX) gained +1.15% this week to 7,811.54 and +2.90% over the month, so equities are supporting risk appetite and reducing the case for defensive gold buying.
The VIX stands at a level of 14.84, a calm, complacent reading, and it fell -3.07% this week and -16.82% over the month. Low volatility removes the safe-haven bid that would otherwise support gold, so the bearish thesis rests on rates and the dollar rather than on fear.
Upcoming Catalysts
- US Consumer Price Index — 2026-10-14: the US CPI print (3.71% YoY last reported) sets the tone for the Fed's hiking path, and a hotter reading would push real yields and the dollar higher, pressuring gold.
- US Producer Price Index — 2026-10-15: upstream price pressures give an early read on consumer inflation, so a firm figure would reinforce the higher-for-longer rate narrative that weighs on gold.
- US Gross Domestic Product — 2026-10-29: the growth reading shapes expectations for rate policy, and a strong print would support Treasury yields and the dollar, both headwinds for gold.
- US Non-Farm Payrolls — 2026-11-06: labour market strength influences the Fed's next move, and a robust report would tend to lift yields and the dollar, while a weak one could revive safe-haven and rate-cut demand for gold.
Trading Idea
Short XAU/USD with an entry zone of 4,200.0–4,230.0 USD, which brackets the current price of 4,216.3 USD and fits the bearish bias, with price below the SMA 20, SMA 50 and SMA 200. Place the stop-loss at 4,285.0 USD, just above the SMA 20 at 4,278.0 USD, because a close above that average would show the sell-off stalling and resistance being reclaimed; the stop sits about 55 USD above the top of the entry zone, roughly 0.7 ATR, enough to absorb normal daily movement at an ATR of 79.6 USD. Target 4,083.7 USD, the lower Bollinger Band, which is the nearest technical level below spot and gives roughly twice the reward of the risk measured from the entry midpoint. Traders can express the view through spot XAU/USD or a physically backed gold ETF, sizing the position so the full stop distance is an acceptable loss.
Price Outlook and FAQ
Tomorrow's expected range is USD 4,136.7 – USD 4,295.9, with spot at USD 4,216.3 sitting inside the band. The one-week bias is bearish: the spot gold price remains below the SMA 20 (4,278.0), SMA 50 (4,357.6) and SMA 200 (4,529.2), so rallies toward those averages face overhead resistance while the 60-day low at USD 3,999.7 is the nearest support still to be tested.
Is gold a good inflation hedge right now? The US CPI stands at 3.71% year on year, but the 10Y real rate (TIPS) is 2.87% and rose on the year from 2.63%, which raises the opportunity cost of holding non-yielding gold. That combination has not favoured gold as an inflation hedge in the current cycle, although the hedge case would strengthen if real rates reversed lower.
How do Fed decisions and the dollar move gold, and what does this mean for gold priced in local currencies? The Fed Funds Rate at 3.75% is a higher-for-longer headwind, and a stronger US Dollar Index (DXY) makes gold more expensive for buyers outside the United States, which pressures demand. In local terms, gold rose 1.33% in CAD and 0.86% in AUD over the week, against a 1.30% USD gain, while the one-month moves of -0.27% in CAD and -0.17% in AUD were smaller than the -3.40% USD decline because both currencies weakened against the dollar over the past 30 days.
Which levels and signals should traders watch this week? Traders should watch whether spot holds above the 60-day low at USD 3,999.7 and how price reacts to the SMA 20 at USD 4,278.0, which is the first overhead barrier. A daily close above the SMA 50 at USD 4,357.6 would challenge the bearish structure, while the MACD line (-57.86) remaining below its signal line (-47.49) would confirm that momentum has not yet turned.
This article is for informational purposes only and does not constitute investment advice or a financial recommendation. Investing in financial assets involves risk.
Key Takeaways for Traders
-
Market stance and entry conditions: The bias remains bearish, with gold at 4,216.3 USD below the SMA 20 (4,278.0), SMA 50 (4,357.6) and SMA 200 (4,529.2). Although gold gained 1.30% this week, traders should look to sell rallies toward the 4,278.0 to 4,357.6 zone rather than chase the bounce, and the bias only changes if price reclaims the SMA 50.
-
Key technical level this week: The SMA 20 at 4,278.0 USD is the nearest resistance, and the Bollinger middle band sits at the same level. RSI at 43.8 remains below the neutral level of 50, and the MACD line (-57.86) is below its signal line (-47.49), so the bearish crossover is in place. The 60-day low at 3,999.7 USD is the nearest support to watch.
-
Macro driver to monitor: The Fed Funds Rate at 3.75% and the Fed's signal that higher rates are expected keep pressure on gold. The 10Y real rate (TIPS) at 2.87% edged down by 0.05 points, which is a mild tailwind, but it remains above its year-ago level of 2.63%, which keeps the opportunity cost of holding gold elevated. The US Dollar Index (DXY) at 102.21 rose 0.27% this week, which weighs on gold for buyers outside the United States.
-
Flow or positioning signal: Gold ETFs recorded a net inflow of about $9.95 billion (+67.3 tonnes) for the 2026-09-01 data month, which shows real buying interest and conflicts with the bearish price structure. Non-commercial speculators hold a net long of 210,335 contracts, which is bullish, but it fell by 21,625 contracts week over week as speculators trimmed longs. The commercial net short of -244,527 contracts reflects producer hedging, which is a bearish-to-neutral signal.
-
Main risk: A bearish call could fail quickly if geopolitical developments, such as the ongoing discussions with Iran, drive a safe-haven bid, or if weaker US data reverses the Fed's hawkish guidance. Gold's 1.30% weekly gain shows that short-covering can produce sharp moves, so the stop should sit clearly above the nearest resistance rather than at a tight level.


