Market Bias
Bearish to Neutral—the current spot price of $4,107 trades below both the 50-day moving average at $4,187.9 and the critical 200-day resistance near $4,483.7, confirming a structural downtrend despite short-term stabilization above the SMA-20. The RSI of 50.2 sits marginally within neutral territory rather than in bullish expansion, while MACD remains negative at -29.12. While ETF outflows continue to pressure spot prices and commercial hedgers maintain net-short positions that reinforce a cautious stance for XAU/USD, the broader macro backdrop of elevated real rates via TIPS yields limits immediate upside potential until central bank policy shifts decisively toward rate cuts or geopolitical risk premiums intensify significantly.
Executive Summary
The gold price today (XAU/USD) is trading at $4,107.0 in a strong downtrend despite posting a 0.97% gain over the last week. While speculative positioning remains bullish on futures contracts, significant ETF outflows totaling approximately $-9.2 billion highlight institutional caution and selling pressure in physical-backed funds. The current spot gold price reflects a delicate balance where rising real interest rates continue to weigh on prices by increasing the opportunity cost of holding this non-yielding asset. Investors must navigate elevated yields alongside geopolitical risks that often provide safe-haven support, making today’s XAU/USD analysis critical for short-term traders watching key technical levels near $4,070 and $3,962.
Global Outlook: Fed Policy, Real Rates, and Gold's Safe-Haven Premium
- Fed Funds Rate remains at 3.63%, with market expectations for stability in the near term given that GDP growth is steady at 2.1% year-over-year while inflation has cooled but persists annually around 3.7%.
- The US CPI annual rate of 3.73% continues to anchor real rates, reflected directly by a positive 10Y Real Rate (TIPS) yield of roughly 2.4%, which currently acts as the primary opportunity cost for holding non-yielding gold.
- Rising or sustained real interest rates increase this borrowing and storage cost, dampening demand from global buyers, though a weaker DXY at current levels near 99.8 after its recent weekly decline partly offsets this.
Technical Analysis
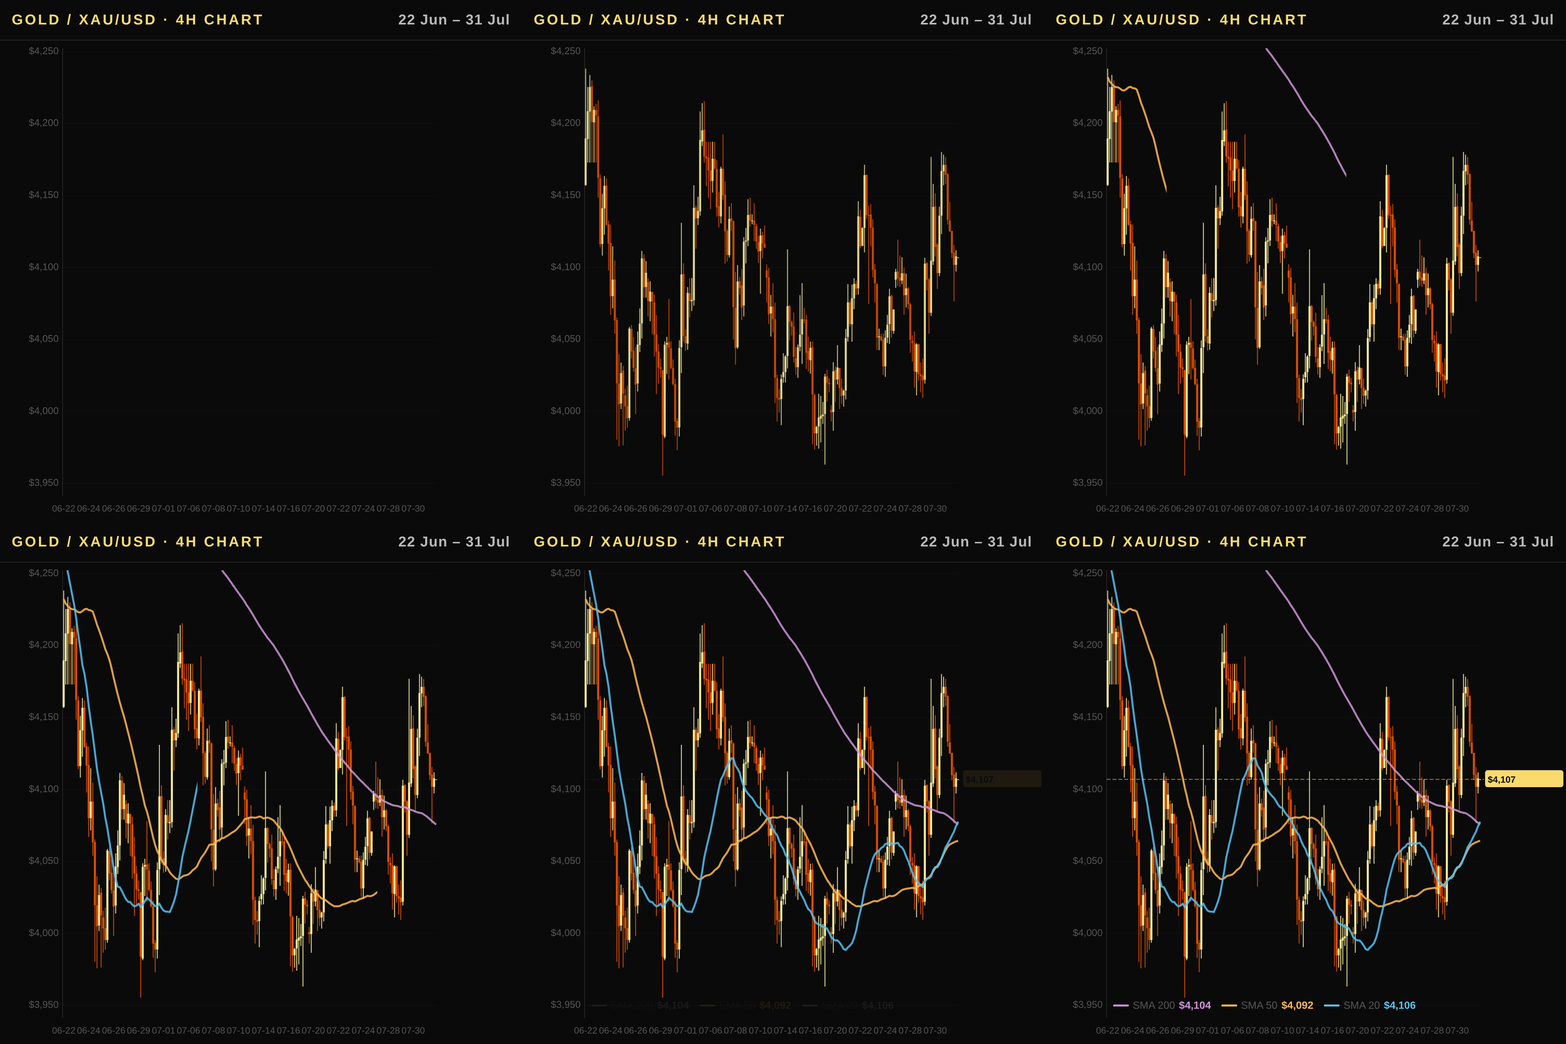
Gold is currently trading at $4107, maintaining a strong downtrend as price action tests key moving averages overhead. The spot gold price sits below both the 50-day and 200-day simple moving averages, which act as dynamic resistance zones while holding just above the shorter-term 20-period average for support.
The SMA $4187.9 represents immediate bearish pressure, requiring a decisive break to reverse momentum toward recent highs near $4765. Conversely, the SMA $4070.1, which coincides with Bollinger Bands' middle band, acts as short-term support that price has briefly touched but failed to sustain above in this session. The 200-day moving average at $4483.7 looms significantly higher and must be reclaimed before any sustained bullish momentum can develop over the longer term.
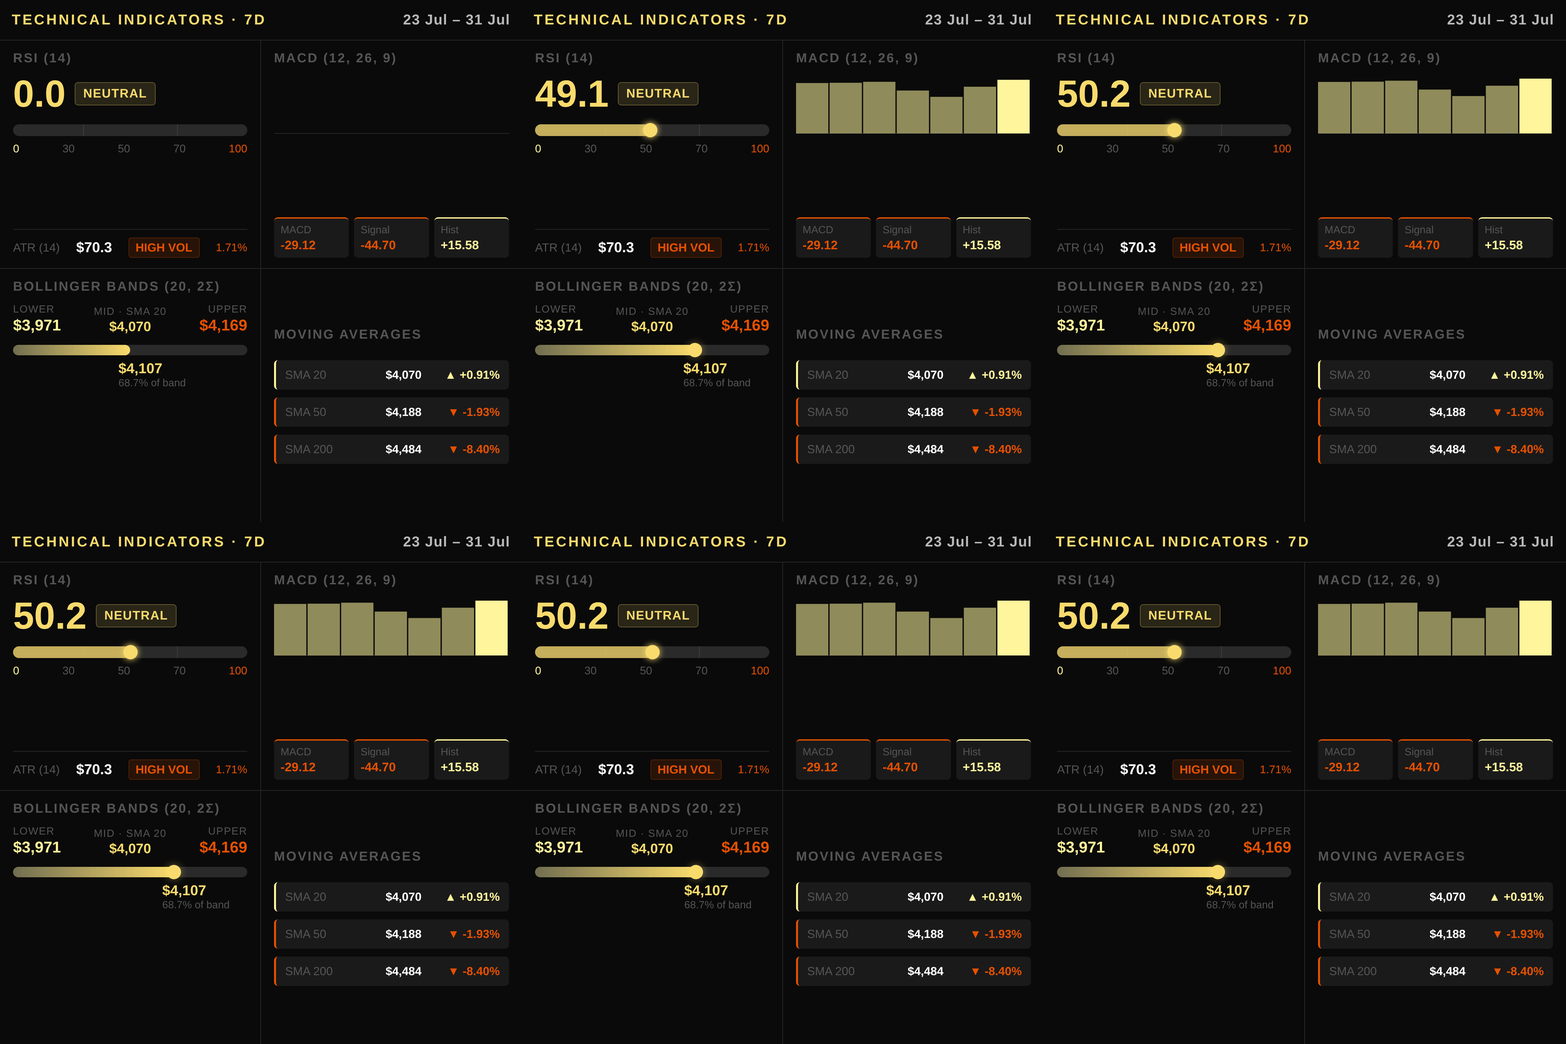
Momentum indicators reflect a complex bearish environment with easing selling pressure. The RSI sits precisely at 50.2, just barely above the neutral level of 50, indicating that gold is hovering between consolidation ranges rather than entering oversold territory or approaching overbought conditions. Meanwhile, the MACD line remains negative at -29.12 but trades above its signal line of -44.69. This bullish crossover inside a downtrend is precisely what produces the positive histogram value of 15.58, which signals that downside momentum is decelerating rather than accelerating.
Volatility contraction is evident within Bollinger Bands, with price oscillating between the upper band at $4169 and lower band support near $3970. The ATR reading of 70.3 suggests moderate volatility persists as traders digest recent macroeconomic data ahead of upcoming economic releases. Key resistance remains anchored at the 60-day high, while critical support sits just below current levels around the monthly low region and SMA confluence zone.
Macroeconomic Factors
The current US Federal Reserve policy rate stands at 3.63%, maintaining a restrictive stance that continues to weigh on non-yielding assets like gold while market expectations for future cuts remain contingent on inflation data cooling further. Although the nominal 10-year Treasury yield has risen slightly, it is the real interest rates measured by TIPS — currently standing at 2.41% — that dictate the opportunity cost of holding spot gold; any upward drift in this metric would act as a significant headwind for prices over coming months. The US Dollar Index (DXY) recently declined -1.65% on the week, which has provided temporary support to global demand by lowering the effective price of XAU/USD for non-US buyers, though a sustained rally in risk-off scenarios or renewed dollar strength could reverse this dynamic quickly. Geopolitical tensions continue to underpin gold’s safe-haven premium as investors seek protection against potential market disruptions stemming from ongoing conflicts; however, these drivers often fade once priced in unless new escalations occur near actual dates of escalation rather than months-old reports.
Positioning and Market Flows
COT data reveals a complex picture for XAU/USD positioning as of late July 2026, with non-commercial speculative net longs at 182,070 contracts, reflecting bullish sentiment among large institutional traders despite recent price weakness. However, the week-over-week change shows these speculative positions have trimmed their exposure by -11,949 contracts over the past week, signaling caution from hedge funds and managed money even as they maintain a net long stance. Commercial hedgers remain short with 212,309 contracts, which aligns with producer risk management rather than bearish bets on gold prices falling further.
ETF flows present the clearest immediate headwind for spot demand: holdings dropped by -76.5 tonnes in June 2026 alone, equivalent to a negative USD flow of approximately $-9.19 billion. These substantial outflows indicate that institutional investors are actively reducing exposure via ETF shares, creating selling pressure that must be offset before price stabilization can occur on the spot market.
Central bank demand continues to provide structural support for XAU/USD over multi-year horizons as nations diversify reserves away from traditional fiat currencies, though this buying does not directly counteract short-term retail and institutional outflows seen in ETF data.
Correlated Assets
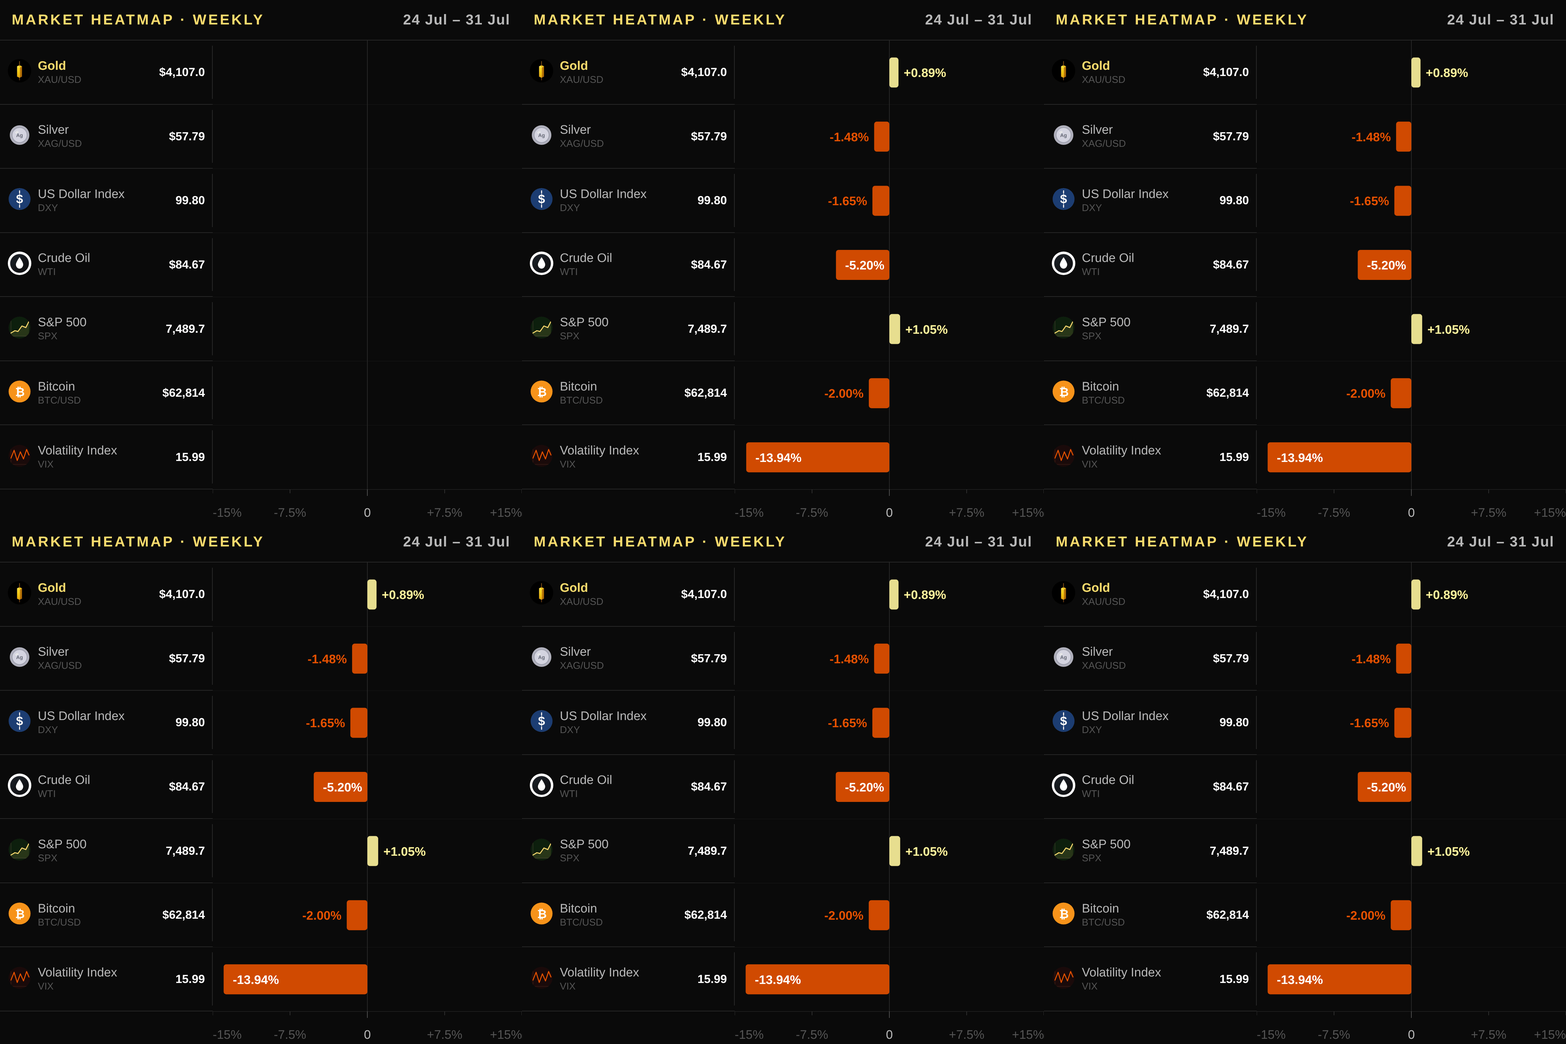
Gold's inverse relationship with the US Dollar Index (DXY) is currently supportive, as a decline of 1.65% over the past week reduces the effective cost for non-US buyers and lifts global demand. Meanwhile, spot gold price dynamics face headwinds from rising nominal yields on the benchmark bond; however, real rates remain stable at 2.41%, preventing a severe drag on sentiment despite higher opportunity costs for this non-yielding asset.
The rise in US10Y to 4.75%, up 1.41% on the week, raises the opportunity cost of holding bullion and works against precious metals. In contrast, copper prices have risen by 5.74% over the month due to industrial demand resilience, creating a divergence where industrial commodities outperform non-yielding gold amid steady economic growth expectations.
Silver has weakened alongside XAU/USD with a weekly drop of -1.48%, signaling broad-based metal weakness rather than isolated underperformance in bullion alone. The VIX index is down 13.94% this week, indicating reduced market fear which typically dampens safe-haven flows to gold unless geopolitical risks escalate unexpectedly. WTI crude oil rose by 23.26% over the month on supply concerns from conflict zones, but weekly weakness of -5.2% suggests transient sentiment driven by specific regional events rather than sustained energy inflation threats that would force higher real rates and hurt precious metals further.
Bitcoin has dropped 1.25% this week to settle near $63,072 after outperforming equities during earlier volatility spikes; while it continues its own trajectory as a distinct risk asset, gold retains its superior status for portfolios seeking preservation against inflation measured by US CPI at 3.73%.
Upcoming Catalysts
- US Non-Farm Payrolls — 2026-08-07: Employment data will be scrutinized for signs of labor cooling, which could alter Federal Reserve rate cut expectations and influence real rates that drive gold prices today.
- US Consumer Price Index — 2026-08-12: The release of core and headline inflation figures is a primary determinant for the path of Fed policy and the opportunity cost of holding non-yielding spot gold price assets globally.
- US Producer Price Index — 2026-08-13: This monthly gauge of wholesale prices serves as a leading indicator for consumer inflation trends, offering clues on whether real interest rates might remain elevated or decline to support XAU/USD analysis scenarios.
- US Gross Domestic Product — 2026-08-26: The quarterly GDP report will reveal the pace of economic expansion and potential recession risks that could trigger safe-haven flows into gold while impacting dollar dynamics ahead of future FOMC Meetings.
Trading Idea
Traders should consider a short position on XAU/USD with an entry zone between $4,107 and $4,169, given that spot gold is trading below its 50- and 200-day moving averages while price remains capped by the SMA 50. A stop loss should be placed above $4,190 to account for potential volatility near the upper Bollinger Band at $4,169 and the SMA 50 at $4,187.9, as a break back above this level would invalidate the bearish technical structure. The primary target is set at $3,962.5, which aligns with the 60-day low and provides room for downside momentum if real rates stabilize or rise further. Investors can execute this strategy by selling shares of SPDR Gold Shares (GLD) or iShares Gold Trust (IAU) on US exchanges, trading COMEX gold futures, or purchasing physical bullion from reputable US dealers like APMEX, JM Bullion, and the US Mint while maintaining a disciplined risk management approach.
Price Outlook and FAQ
The spot gold price is expected to trade within a range of USD $3,985–$4,230 tomorrow, bracketing the current level around USD $4107 with volatility contained by ATR levels near USD 70. For the next week, XAU/USD maintains a Neutral-to-Bearish bias as price action remains suppressed below key resistance at USD $4188 while testing support zones closer to USD $3962.
Is gold currently an effective inflation hedge for US investors given recent economic data? Yes, but with caveats; current annual CPI stands at 3.73%, yet the real interest rate environment remains restrictive with a TIPS yield of 2.41%. While high headline inflation often supports nominal prices, rising real rates increase the opportunity cost of holding this non-yielding asset, which can dampen performance in the short term despite long-term purchasing power preservation benefits for gold price today analysts track closely.
How do Federal Reserve rate decisions and TIPS yields specifically impact spot gold pricing? The Fed Funds Rate sits at 3.63%, but it is the real yield derived from 10Y Real Rate (TIPS) that directly dictates bond-relative returns; when real rates climb, holding non-income-generating assets becomes less attractive to institutional capital flows driving XAU/USD lower. Conversely, any expectation of rate cuts or falling TIPS yields reduces this opportunity cost and typically fuels a bullish trend for the gold price today in technical analysis models focusing on macro fundamentals.
What are the primary mechanisms for US investors to acquire physical or ETF-backed exposure? Investors can access liquid spot markets via SPDR Gold Shares (GLD) or iShares Gold Trust (IAU), which trade on major NYSE exchanges and offer fractional ownership of COMEX futures-linked bullion; those preferring tangible assets may purchase from authorized dealers like APMEX, JM Bullion, or the US Mint. These channels provide distinct advantages regarding storage logistics versus liquidity needs for a robust gold analysis strategy tailored to individual risk profiles.
This article is for informational purposes only and does not constitute investment advice or a financial recommendation. Investing in financial assets involves risk.
Key Takeaways for Traders
- Market Stance: The current market stance is bearish as spot gold trades below both the SMA 50 and SMA 200 moving averages, indicating a strong downtrend despite recent weekly gains; traders should focus on short entries near resistance rather than chasing rallies above overhead technical barriers.
- Technical Level to Watch: Key resistance at USD $4187.9 (SMA 50) must be cleared for any meaningful trend reversal, while the immediate support zone sits around USD $3962.5 where downside momentum could accelerate if price breaks below this level.
- Macro Driver to Monitor: The primary macro driver is real interest rates as measured by US TIPS yields at 2.41%, which currently offer a significant opportunity cost for holding non-yielding gold and act as the central constraint on bullish sentiment until they fall further or stay stable while inflation cools.
- Flow Signal to Track: Large ETF outflows totaling approximately $9.19 billion this month highlight institutional selling pressure that outweighs speculative long positioning in COT futures, suggesting a disconnect between retail hope and genuine capital deployment into the asset class.
- Risk Consideration: The main risk is rising real yields or unexpected dollar strength from Fed policy tightening expectations, which could trigger further declines toward USD $3,962.5 support while geopolitical tensions alone are insufficient to sustain prices without favorable interest rate dynamics.

