Market Bias
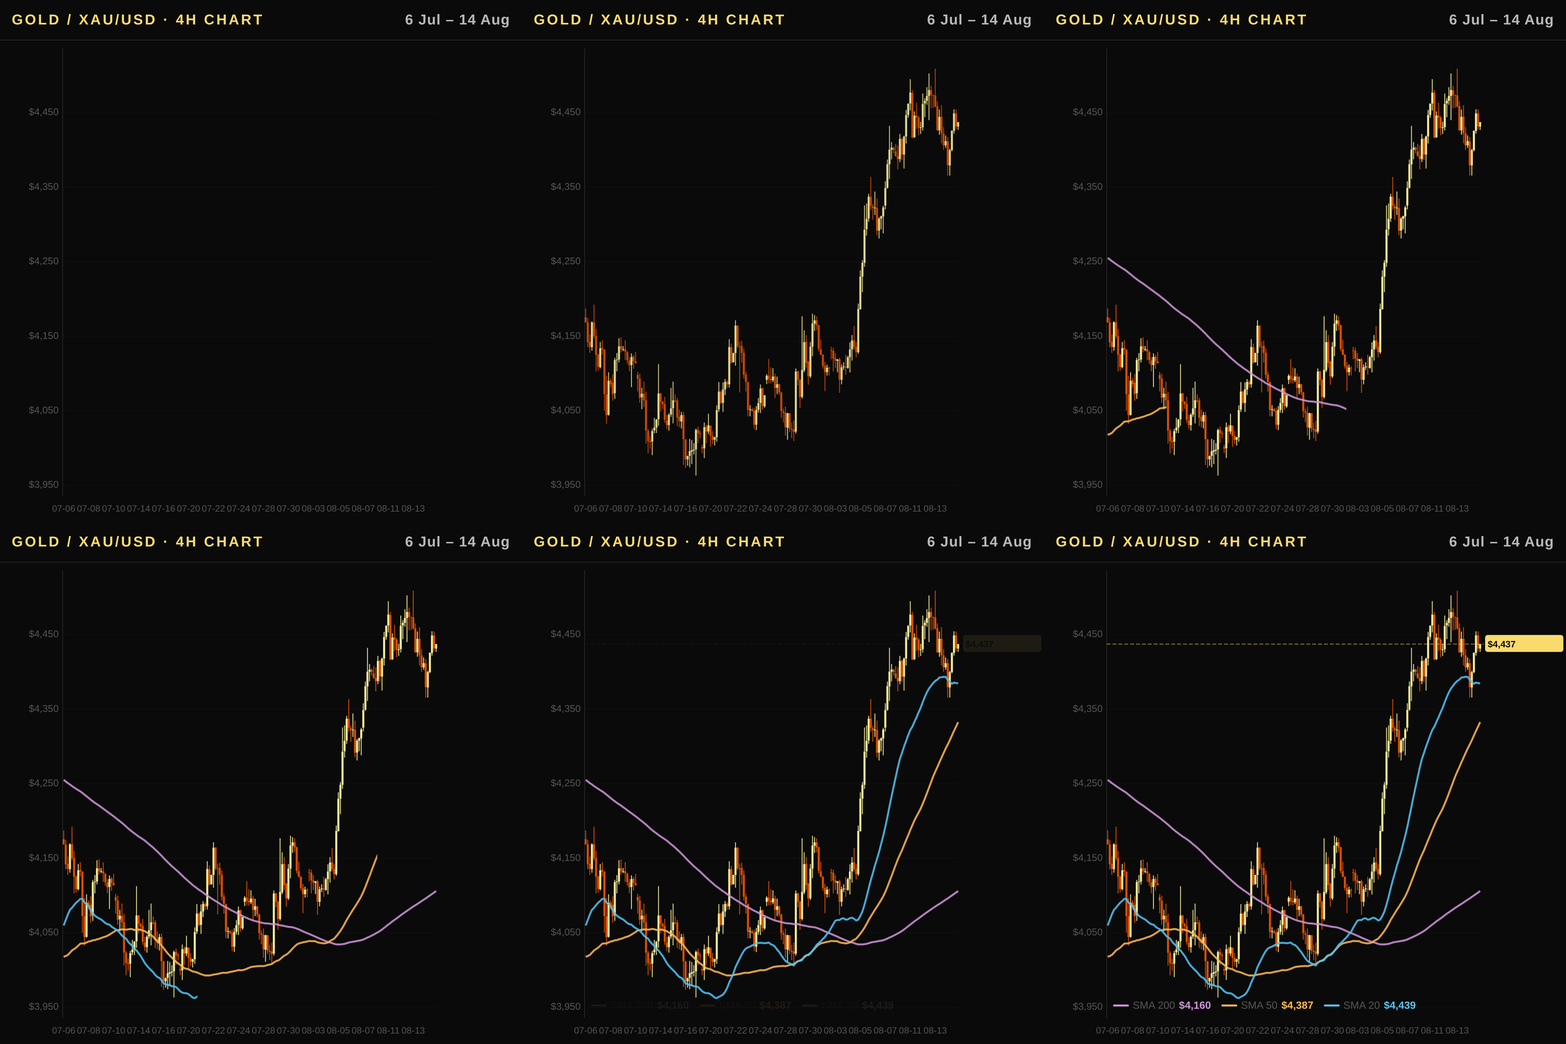
Bullish. Despite trading below its 200-day moving average, XAU/USD maintains a strong uptrend driven by a 2.23% weekly gain, an 11.33% advance over the past month, and robust momentum indicators like RSI at 67.7, which suggests sustained buying pressure remains intact above the neutral level.
Executive Summary
The gold price today stands at $4,437.3 per ounce in a strong technical recovery following an 11.33% gain over the past month amid easing real interest rates and robust ETF inflows of nearly $2.97 billion over the past month. While macro fundamentals remain supportive with U.S. CPI running at 3.54%, the XAU/USD analysis indicates a potential short-term correction as price action approaches key resistance near $4,591.8. The global gold price forecast points to sustained volatility ahead of upcoming catalysts such as US Gross Domestic Product data on August 26 and Non-Farm Payrolls later in September, which could further shape the spot gold price trajectory over the next few weeks.
Global Outlook: Fed Policy, Real Rates, and Gold's Safe-Haven Premium
- Fed policy trajectory: The Federal Reserve maintains a funds rate of 3.63%, with market expectations leaning toward holding steady in the near term as inflation remains stubbornly above target levels. This stable but restrictive stance limits immediate pressure for gold from aggressive cuts while keeping borrowing costs elevated against non-yielding assets, creating friction at current prices despite recent gains.
- Real rates and gold: The 10Y Real Rate (TIPS) currently sits at 2.39%, reflecting the opportunity cost of holding physical bullion or exchange-traded funds like GLD. While real yields ticked down slightly from prior levels, they remain positive enough to dampen demand relative to a scenario where TIPS fall below zero; however, gold has rallied significantly this year (up roughly 11% in one month), suggesting safe-haven flows are currently outweighing the headwind of higher opportunity costs.
- Dollar impact: The US Dollar Index (DXY) is trading near 99.67 with a slight weekly gain but monthly decline, indicating mixed sentiment on dollar strength versus global growth risks. A weaker DXY generally supports XAU/USD by making gold cheaper for international buyers, whereas the current stabilization in the greenback provides some breathing room for price discovery without triggering severe sell-offs from foreign investors who find higher USD costs prohibitive during periods of geopolitical stress.
- Federal Reserve forward guidance: Recent minutes and market pricing suggest the Fed will prioritize data-dependent adjustments rather than pre-set hikes or cuts, effectively capping extreme rate volatility in the 1–3 month window ahead. This predictability reduces uncertainty premiums but keeps gold anchored to technical structures until a definitive pivot in real rates occurs; investors are monitoring every CPI release for signals that might force the central bank into easing before geopolitical risks materialize further.
- US inflation and GDP context: With US annual CPI at 3.54% and GDP growth holding steady around 2.2%, the economy is avoiding a hard landing while inflation remains sticky enough to prevent rapid rate cuts. This economic balance means gold does not yet benefit from the liquidity surge typical of deflationary recessions, though its safe-haven appeal remains intact given global instability that occasionally overshadows domestic US macro metrics in driving spot prices higher today.
Technical Analysis
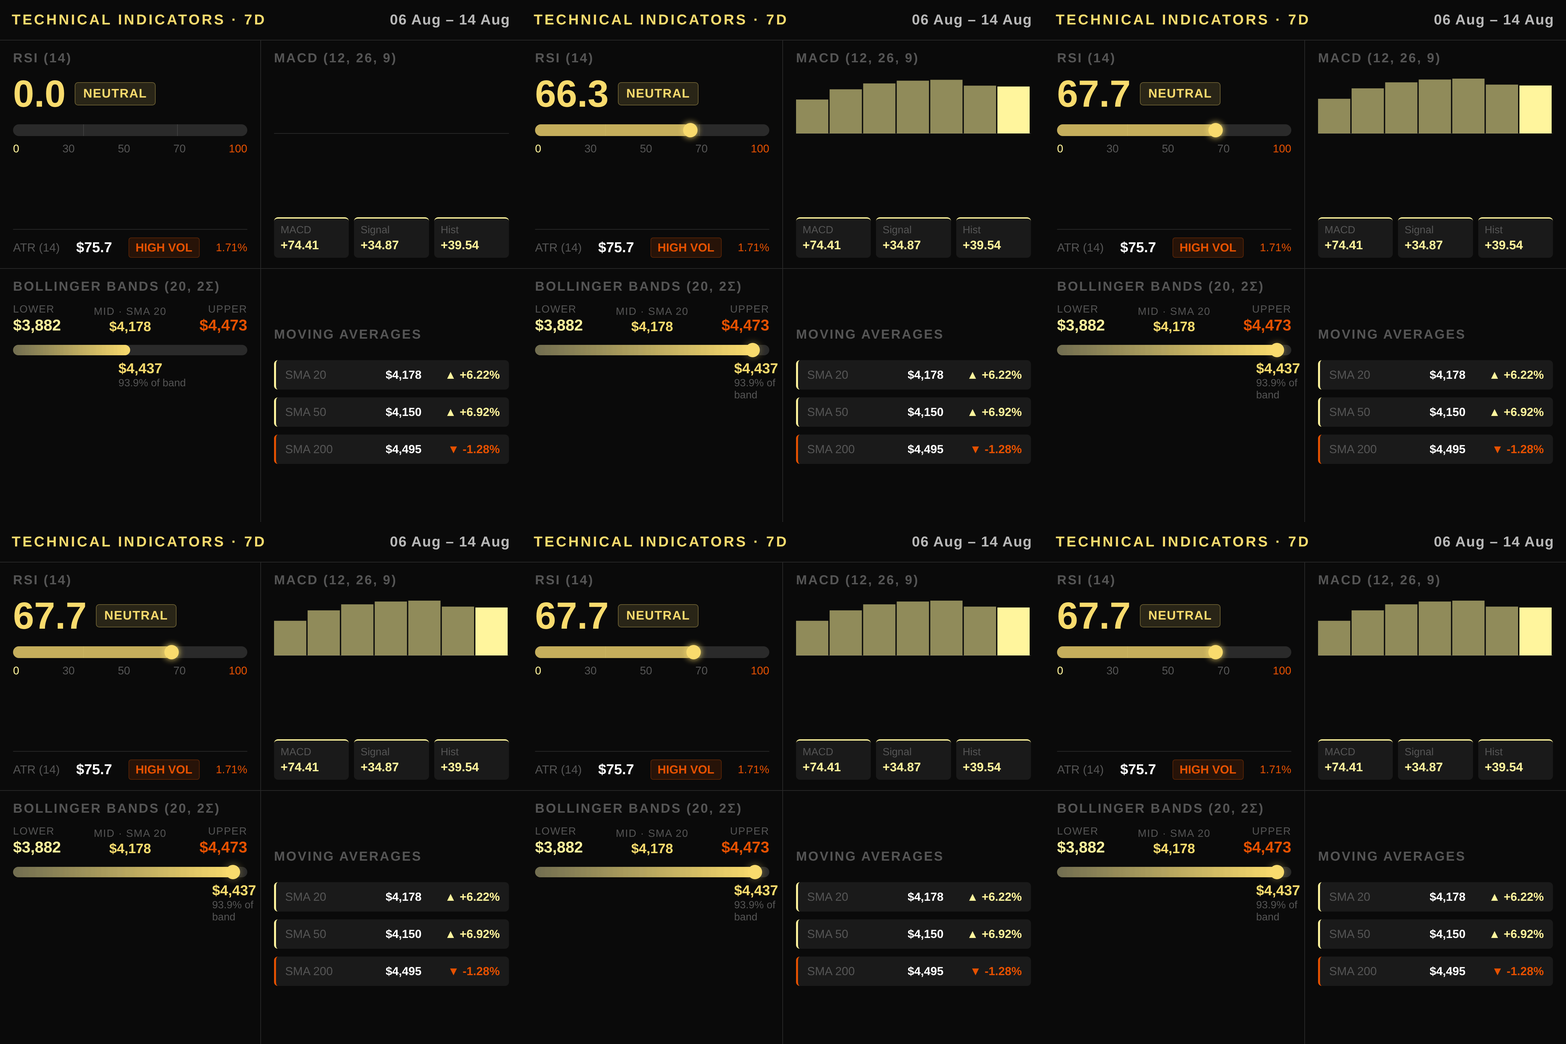
Gold is currently trading at $4,437.30, recovering inside a longer-term downtrend against the USD, having yet to reclaim key overhead resistance with conviction. The price action sits above the SMA 20 of $4,177.5 and comfortably above the SMA 50 at $4,150.1, while remaining below the long-term SMA 200 near $4,494.7 — so the two shorter averages are acting as support and the 200-day as the resistance still to be cleared.
The momentum oscillator RSI sits at a robust level of 67.7, which is technically above the neutral threshold of 50 but indicates strong bullish pressure building ahead of potential exhaustion near overbought territory. The MACD histogram value reads positive at 39.54, suggesting that buying volume in futures markets continues to outweigh selling interest despite the overall bearish price structure against higher lows from recent weeks.
Volatility remains contained within a tight band defined by Bollinger Bands, with current pricing hovering just below the upper limit of $4,473.3 and well above the lower boundary at $3,881.6. The Average True Range (ATR) is calculated at 75.7 points, reflecting moderate market noise that could lead to sharp intraday wicks before a decisive directional move toward support zones or resistance barriers near $4,591.8.
Key technical levels for traders focus on the immediate psychological barrier of $4,600 as primary overhead resistance and the 60-day low around $3,962.5 offering critical downside protection if momentum deteriorates further in USD terms over the coming trading sessions.
Macroeconomic Factors
The Federal Reserve maintains a policy rate of 3.63%, while US CPI is running at 3.54% year-over-year and GDP growth remains solid at 2.2%. This monetary stance keeps real interest rates elevated, with the 10Y Real Rate (TIPS) currently standing at 2.39%; a decline in this figure would reduce the opportunity cost for holding non-yielding gold and support prices higher. Conversely, if inflation stays anchored near its current pace, real yields could drift upward, exerting downward pressure on the spot price even as equity markets hold firm, with the SPX up +0.36% on the week and +3.34% over the month. The US Dollar Index (DXY) is holding steady around 99.67, showing a negligible weekly gain of +0.07% but monthly weakness of -1.05%. A stronger dollar generally suppresses global demand by increasing gold's effective cost for non-US buyers, whereas a weakening DXY would boost international appetite and lift the price in USD terms. Geopolitical tensions continue to provide a structural safe-haven premium that offsets some headwinds from higher real yields; investors turn to physical assets during periods of uncertainty when financial markets like WTI oil at $82.4 per barrel or copper rising +5.03% monthly fail to fully capture the fear dynamic inherent in XAU/USD analysis today.
Positioning and Market Flows
COT data reveals a robust bullish stance among speculative traders in gold futures, with non-commercial net long contracts at 217,940 units reflecting strong institutional accumulation ahead of potential price appreciation. This positioning aligns perfectly with the broader market flow trends rather than contradict them.
Gold ETF holdings show consistent inflows totaling $2.96 billion monthly over the past period, signaling sustained investor appetite for physical-backed exposure despite recent volatility in other digital assets like Bitcoin which has seen minor weekly declines of roughly one percent this week alone. Such persistent demand from exchange-traded funds underscores gold’s role as a reliable store of value during uncertain macroeconomic environments while contrasting with outflows that would otherwise signal distribution by large investors moving away from the asset class entirely.
Central bank buying continues to provide structural support for spot prices, particularly amid geopolitical tensions and currency devaluation risks across emerging markets globally where local currencies weaken relative to USD holdings over extended periods driving sovereign demand higher than usual historical norms observed during previous cycles when real rates were less negative or even moderately positive depending on inflation dynamics prevailing at any given point in time.
Correlated Assets
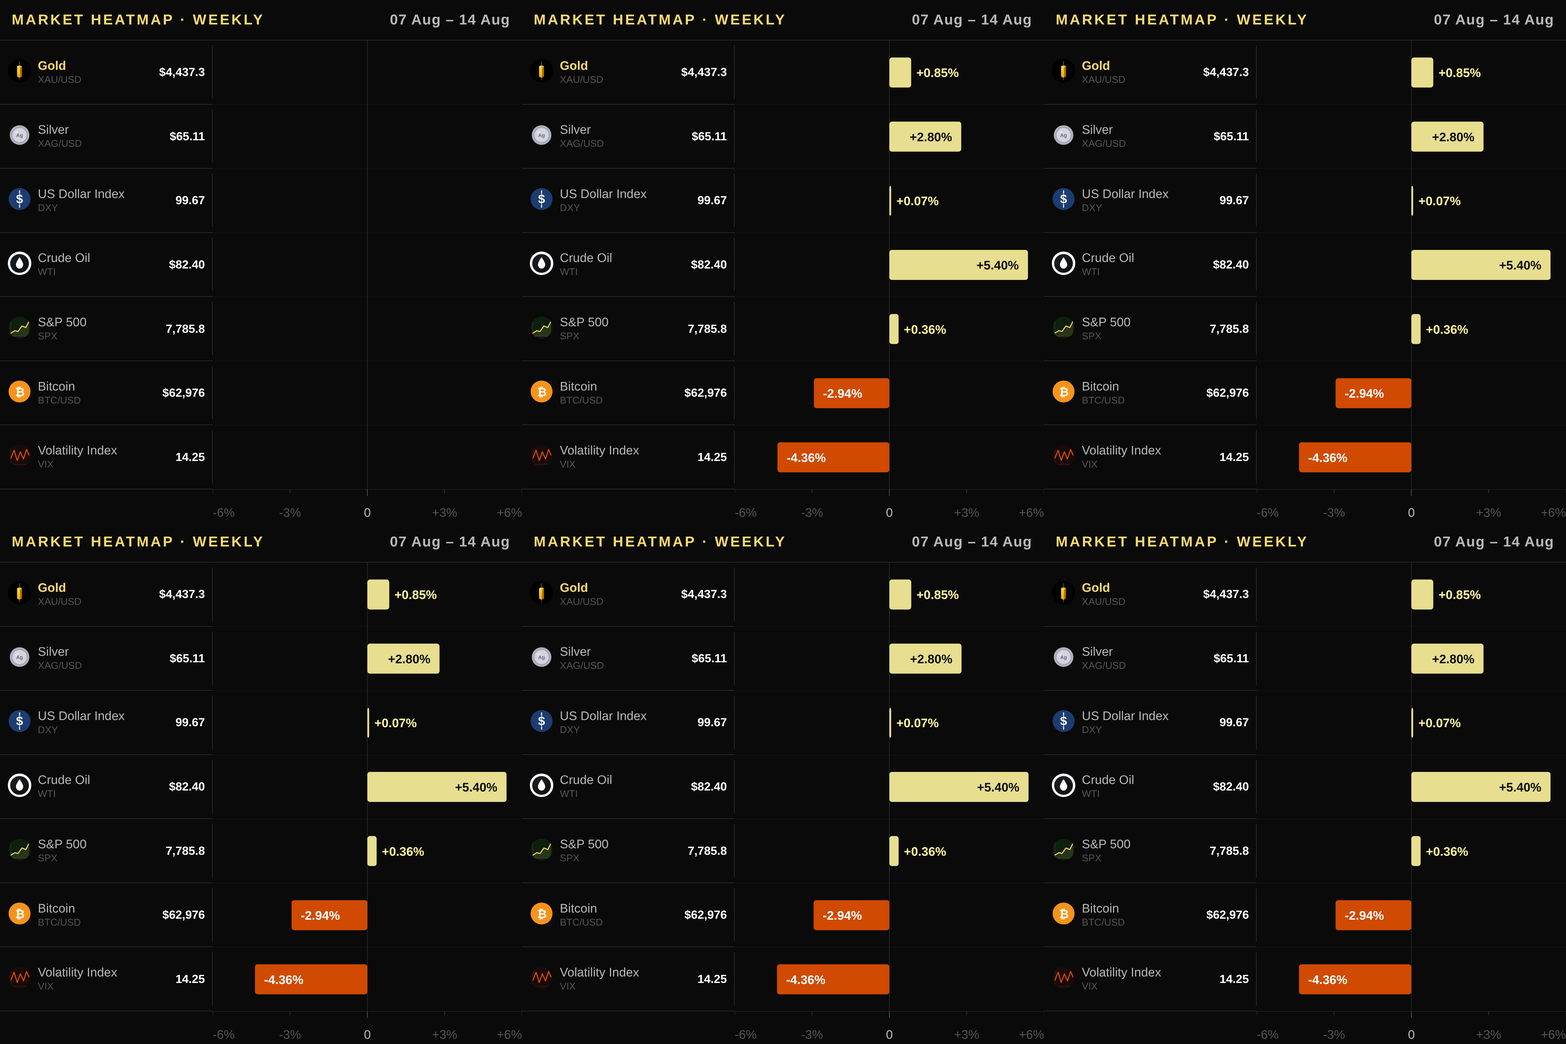
Gold’s immediate upside faces only mild currency headwinds: the US Dollar Index (DXY) is essentially flat on the week at +0.07% and down -1.05% over the month, which on balance lowers gold’s effective cost for foreign buyers. Real interest rates remain the firmer constraint, holding at 2.39% and keeping the opportunity cost of non-yielding spot gold elevated, while copper futures have edged higher with a weekly gain of +0.65% and a stronger +5.03% monthly advance, pointing to steady industrial demand alongside the safe-haven bid. Silver has rallied alongside XAU/USD for 2.8% this week and surged 16.48% over the month, acting as both an inflation hedge and a leveraged play on gold demand in sectors like photovoltaics where supply constraints continue to support prices despite macro headwinds. US equities remain resilient with the SPX up 0.36% weekly while oil markets have strengthened considerably with WTI crude gaining +5.4% over seven days, indicating energy security concerns may be driving inflationary pressures that could eventually favor gold in a stagflation environment if central banks pivot to easing cycles soon enough. The volatility index (VIX) has dipped sharply by 4.36%, signaling diminished fear premiums but this does not negate the structural safe-haven demand for gold which remains sensitive to any escalation in global conflicts or sudden shifts in geopolitical risk dynamics that could reverse the current calm sentiment quickly without warning from markets expecting stability where none exists permanently across all asset classes globally today.
Upcoming Catalysts
- US Gross Domestic Product — 2026-08-26: A potential shift in growth expectations could alter Fed policy path and impact real rates, which directly influence gold's opportunity cost.
- US Non-Farm Payrolls — 2026-09-04: Labor market strength or weakness will dictate the pace of future rate adjustments, a primary driver for spot gold price direction over the next quarter.
- US Producer Price Index — 2026-09-10: Emerging inflation signals here might precede core CPI updates and affect investor positioning in non-yielding assets like XAU/USD.
- US Consumer Price Index — 2026-09-11: This headline number is critical for recalibrating real rate expectations, which will determine the immediate gold price forecast following the release.
Trading Idea
Given that spot gold price is trading above its 20- and 50-day moving averages with a positive MACD histogram and bullish COT positioning, traders should consider entering long positions in the $4380–$4475 zone near current support levels. A stop loss below $4160 protects against a breakdown beneath the 20-day SMA if downside momentum resumes following resistance rejection at the 60-day high of $4591. The upside target is positioned around $4700, which represents a logical extension based on recent weekly gains and the next psychological barrier above current Bollinger Band limits. US investors can execute this strategy through SPDR Gold Shares (GLD), iShares Gold Trust (IAU) ETFs listed on NYSE exchanges, or by purchasing physical bullion from accredited dealers such as APMEX or JM Bullion.
Price Outlook and FAQ
Gold is expected to trade between $4305.17 and $4569.43 tomorrow as it navigates near its 20-period Bollinger Band resistance of $4473.3 while maintaining a bullish short-term stance supported by strong weekly momentum (+2.23%). For the upcoming week, the directional bias remains Bullish with key pivots at the immediate overhead resistance of $4591.8 and support near the SMA 20 at $4177.5.
Is gold currently a good inflation hedge for US investors given recent CPI data? Gold is demonstrating its resilience as an inflation hedge because it has rallied significantly even while annual US CPI remains elevated at 3.54%. However, this effectiveness depends on real rates; the current yield on TIPS stands at 2.39%, which helps keep opportunity costs manageable compared to periods where real yields were much higher.
How do Fed rate decisions and the real interest rate yield affect gold prices? The Federal Reserve’s policy stance directly dictates the opportunity cost of holding non-yielding assets like gold through the TIPS yield mechanism. When rates fall or stay lower, as they are expected near a 3.63% federal funds rate with stable inflation expectations, capital flows often rotate into precious metals to capture higher real returns relative to bonds.
What specific instruments should US investors use to acquire physical or digital gold exposure? US-based investors can gain instant market access through the SPDR Gold Shares (GLD) and iShares Gold Trust (IAU), which trade on major exchanges like NYSE with high liquidity for fractional ownership of spot metal. For those preferring physical delivery, reputable dealers such as APMEX, JM Bullion, or direct purchases from the US Mint allow investors to hold tangible bullion securely in their personal accounts.
This article is for informational purposes only and does not constitute investment advice or a financial recommendation. Investing in financial assets involves risk.
Key Takeaways for Traders
- Market Stance: The XAU/USD market is currently Bullish as price holds above the SMA 20 and SMA 50 with a positive MACD histogram and a +2.23% weekly rally, though the SMA 200 at $4,494.7 remains overhead and must be cleared to confirm a full trend reversal.
- Technical Level: Traders should watch the resistance near $4,591.8 alongside the RSI at 67.7; a failure to break this zone could see price retreat toward support around $3,962.5 as momentum wanes in USD terms.
- Fundamental Driver: Monitor the trajectory of US inflation and real interest rates (TIPS yield) since any upward drift in TIPS would increase gold’s opportunity cost and reinforce downward pressure on spot prices.
- Flow Signal: Gold ETF flows show a net inflow bias, but speculative positioning in futures is already bullish via non-commercial longs; this divergence suggests institutional buying may be absorbing supply to prevent further downside rather than driving an immediate surge higher.
- Risk Consideration: A sudden spike in the US Dollar Index (DXY) or sharp rise in real yields would quickly invalidate long positions, so hedge equity portfolios by reducing gold exposure if geopolitical calm returns without corresponding rate cuts from the Fed.

