Market Bias
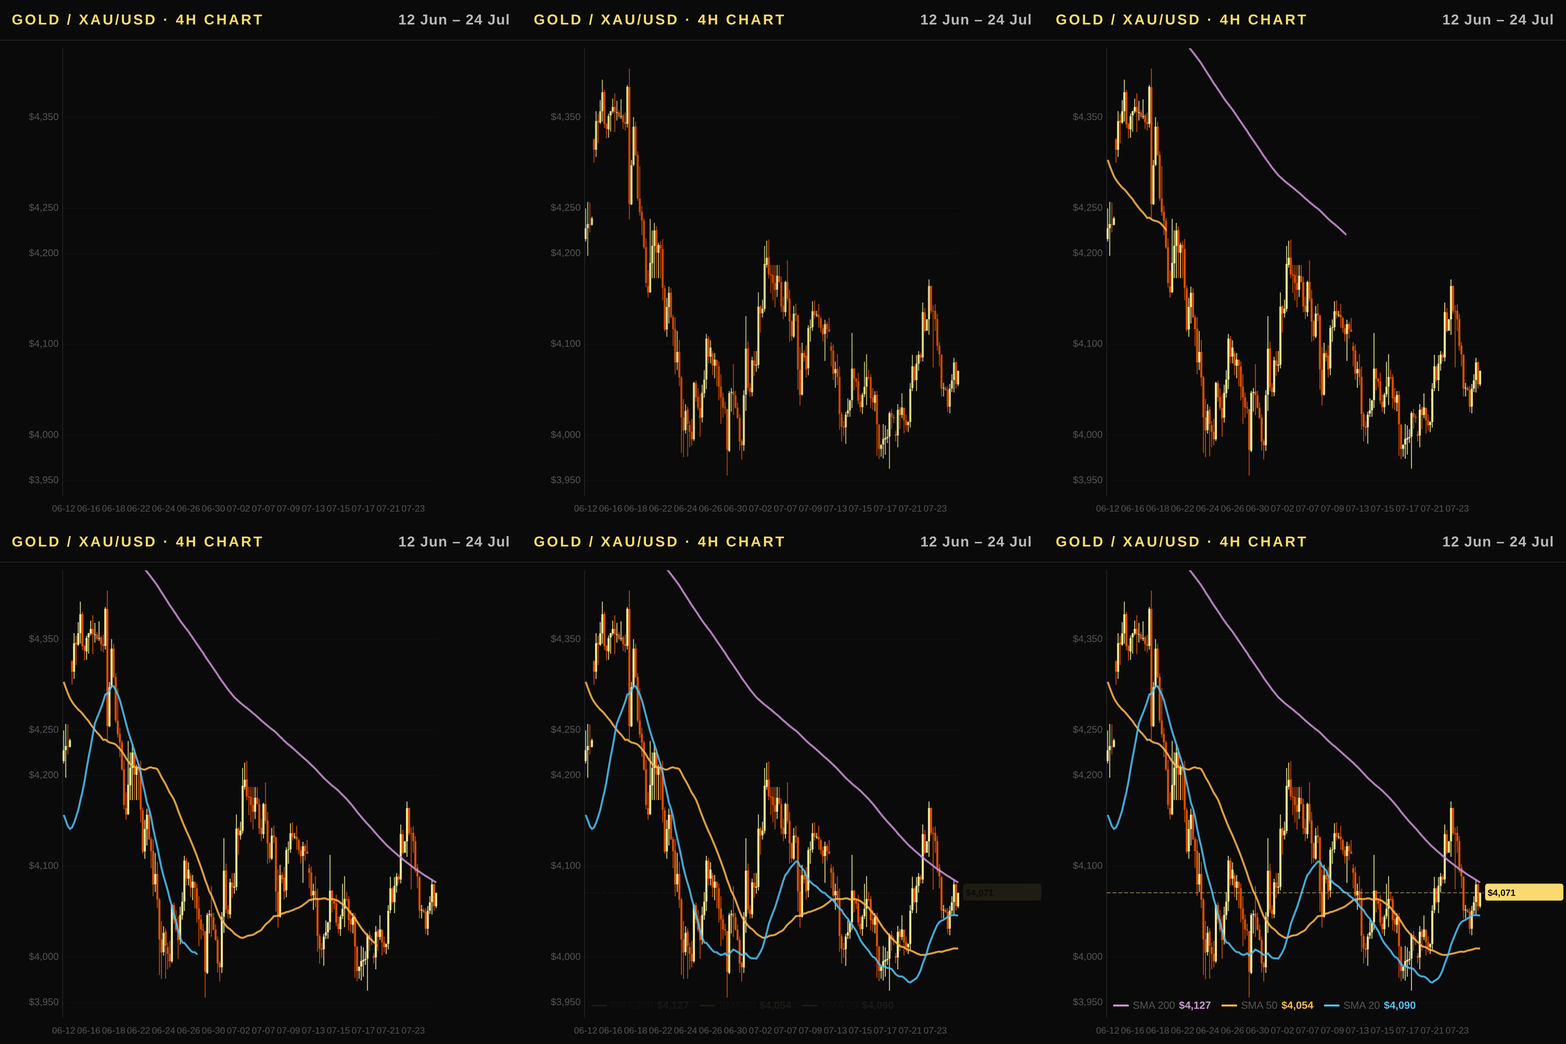
Bearish: Gold is trading below its 50-day ($4,233.9) and 200-day ($4,486.4) moving averages with a strong downtrend confirmed by the technical structure despite recent weekly gains.
Executive Summary
Gold Price Today (XAU/USD) consolidates near $4,067.6 amid a persistent downtrend as rising real rates and ETF outflows weigh on sentiment. Despite speculative positioning in futures turning bullish via COT data of +183,910 contracts, institutional demand remains weak with monthly flows recording -$9,186 million in gold ETFs. Macro headwinds persist as the 10Y Real Rate (TIPS) climbs to 2.43%, increasing the opportunity cost for holding this non-yielding asset. While geopolitical tensions provide a temporary floor, the technical structure below key moving averages suggests caution until real yields stabilize or central bank buying surges again in the global gold market landscape.
Global Outlook: Fed Policy, Real Rates, and Gold's Safe-Haven Premium
- The Federal Funds Rate stands at 3.63%, with market expectations for further cuts tempered by persistent inflation data keeping real rates elevated.
- Rising 10Y Real Rate (TIPS) of 2.43% increases the opportunity cost for holding non-yielding gold, creating a significant macro headwind for the spot price today.
- A stronger US Dollar Index (DXY at 101.43) raises the effective cost of XAU/USD for foreign buyers, suppressing global demand and exerting downward pressure on technical levels.
- Fed forward guidance suggests rates will remain restrictive until inflation convincingly falls to target, limiting near-term catalysts for a rate-cut pivot that would boost gold prices.
Technical Analysis
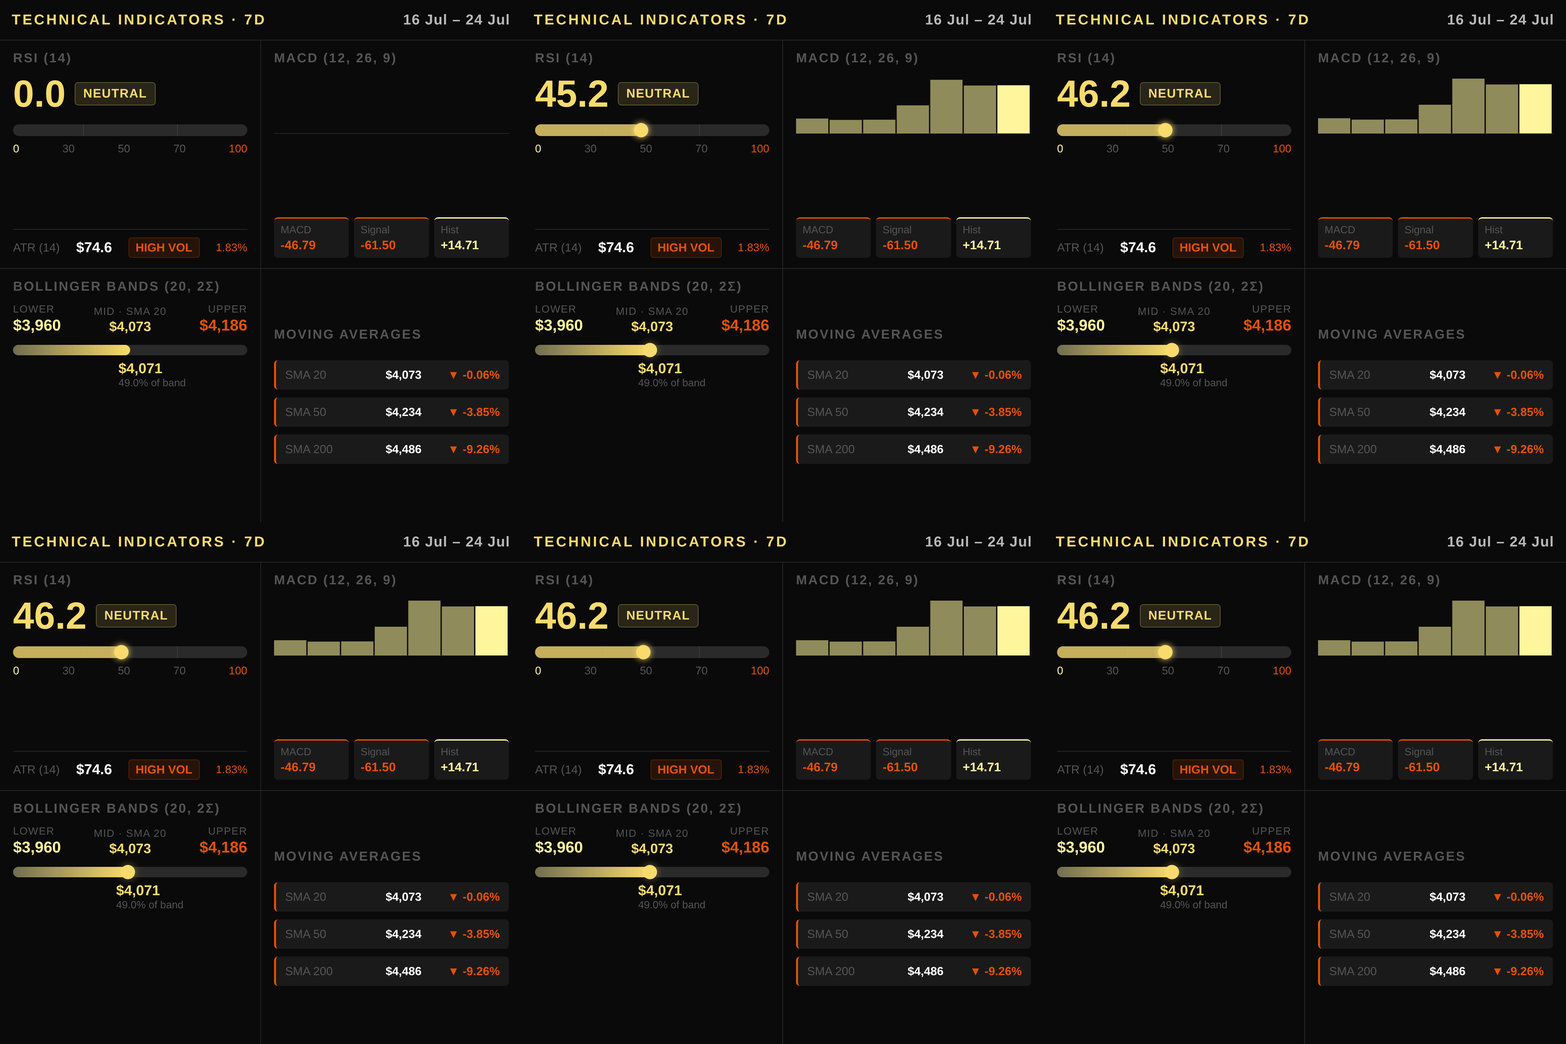
Gold is currently trading at $4067.6, holding just below its 20-day simple moving average (SMA) of $4073.1 while sitting beneath both the 50-day SMA ($4233.9) and the longer-term 200-day SMA at $4486.4. This structural bearish alignment confirms a strong downtrend, with price action failing to reclaim key overhead averages that now act as primary resistance zones. The Relative Strength Index (RSI) reads 46.2, positioning the asset squarely below the neutral level of 50 and indicating weakening bullish momentum without yet entering oversold territory. Meanwhile, the MACD line sits at -46.79 against a signal line of -61.5; although the histogram is positive at +14.71 suggesting some short-term easing in downside pressure, the overall trend remains negative as long as price trades below these dynamic averages. The 20-period Bollinger Bands frame current volatility with an upper band near $4186.4 and a lower boundary around $3959.8; gold is currently nestled just beneath the middle band (the SMA), reflecting consolidation within this range before potential directional extension. Average True Range measures at 74.6, signaling moderate daily fluctuations typical for non-yielding assets in an uncertain macro environment. Key support rests near the recent low of $3962.5, while resistance is anchored by the 60-day high around $4765.2; a decisive break above the SMA 50 would be required to invalidate the prevailing bearish structure and signal a trend reversal toward higher levels.
Macroeconomic Factors
The Federal Reserve maintains its policy rate at 3.63%, with market pricing in gradual cuts contingent on inflation data cooling further ahead of upcoming FOMC decisions. Current real rates, measured by the 10Y Real Rate (TIPS) at 2.43%, have risen over recent months, increasing the opportunity cost for holding non-yielding gold and exerting bearish pressure despite safe-haven demand from geopolitical tensions. The US Dollar Index (DXY) remains stable near 101.43 after a modest weekly gain of 0.69%, limiting global buying interest as higher effective prices dampen demand outside the United States. Meanwhile, U.S. annual inflation sits at 3.73%, keeping nominal yields elevated and constraining central bank accommodation in the short term. Geopolitical instability continues to provide a floor for spot gold price action, offsetting some of the headwinds from tighter monetary policy expectations.
Positioning and Market Flows
The CFTC’s latest Commitment of Traders report reveals a speculative bias toward bullishness, with non-commercial net longs rising to 183,910 contracts over five weeks despite price weakness. This accumulation by hedge funds suggests that sophisticated speculators are positioning for a potential technical rebound from current oversold levels near the SMA-20 support zone.
Institutional demand shows divergence through ETF flows, which recorded significant outflows worth approximately $9.19 billion in June alone. These substantial withdrawals indicate a short-term rotation away from bullion allocation or active selling by large asset managers amid uncertainty, creating a bearish counterweight to futures positioning and pressuring the spot price lower against higher yields.
Central bank demand continues to provide a multi-year structural floor for gold prices independent of Western capital flows. While sovereign reserves have been accumulating physical metal steadily since 2023, this steady buying does not fully offset recent retail-driven ETF declines or speculative net-long positioning in futures markets.
Correlated Assets
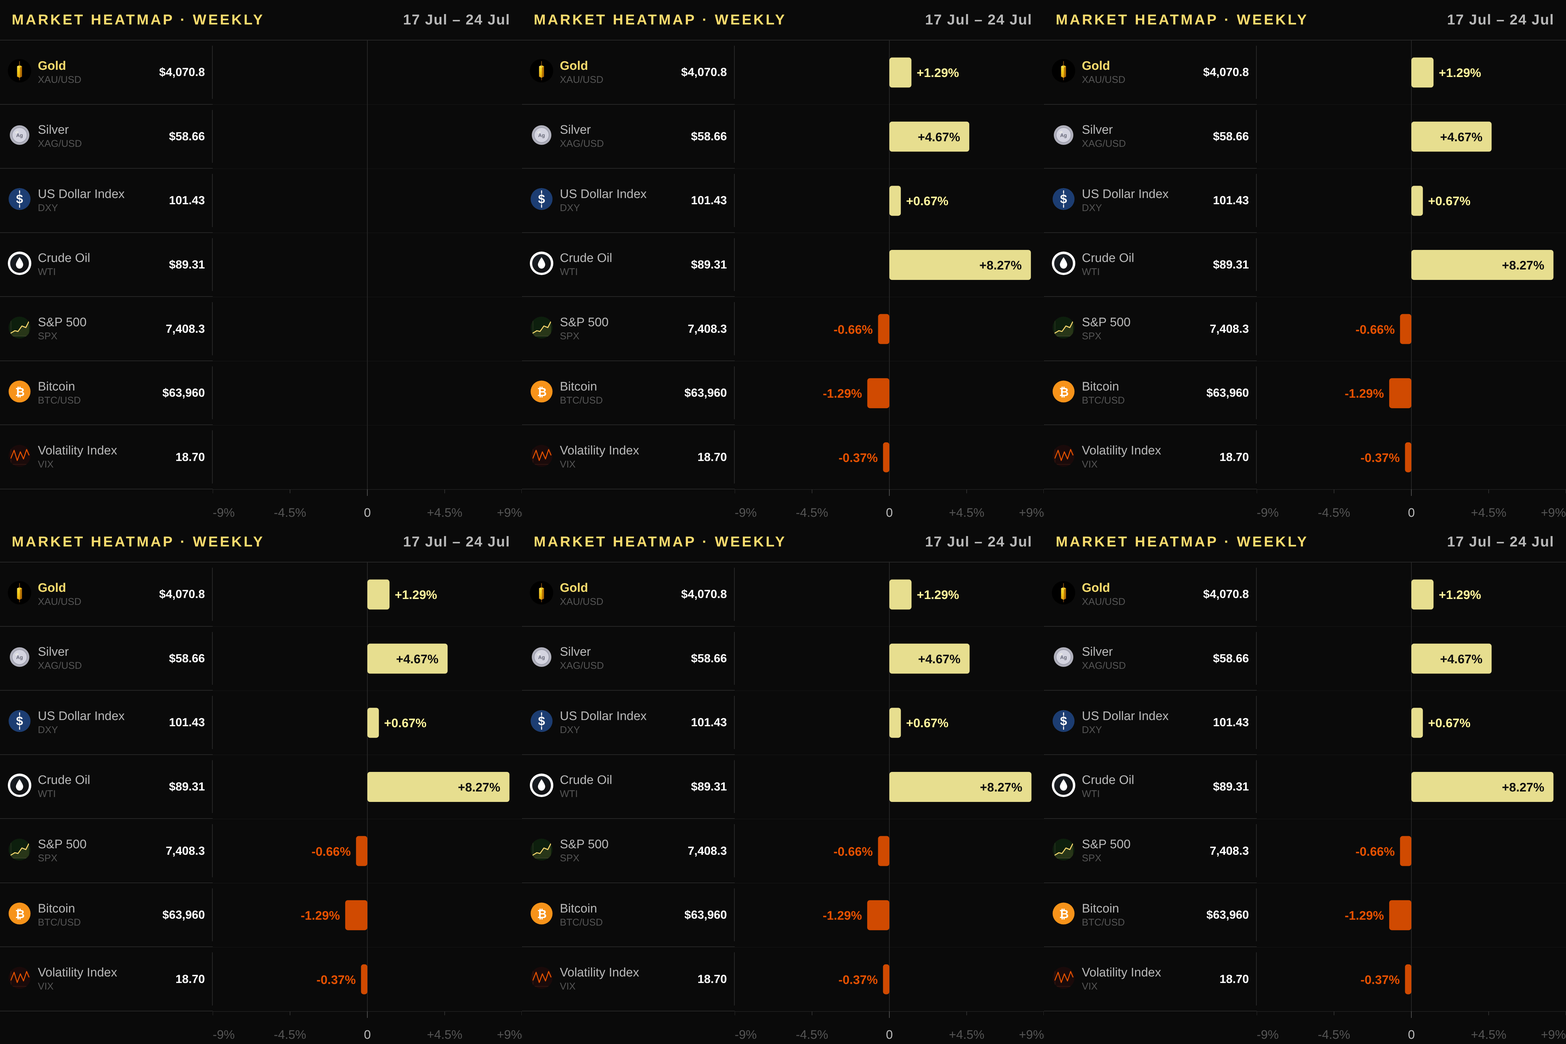
Gold's correlation with major assets confirms its mixed current role as both a monetary hedge and an inflation play, though recent data highlights divergent trends across commodities and equities that require nuanced interpretation for investors tracking XAU/USD today. The US Dollar Index (DXY) sits at 101.43 after rising 0.69% this week while remaining flat monthly; its persistent strength imposes a headwind on the spot gold price by making bullion more expensive for non-US buyers, despite broader geopolitical risks that typically support safe-haven demand. This inverse relationship remains intact as the dollar strengthens alongside higher real yields driven by US Treasury dynamics and Fed policy expectations for prolonged rates near 3.63%. Meanwhile, copper futures trade at USD 6.32 per pound with notable weekly gains of +1.61% and monthly increases of +4.11%, reflecting industrial demand resilience even as rising production costs temper some optimism about a supply-led rally in the broader commodities complex that includes silver. Silver itself faces pressure from its own technical weakness, having dropped 0.9% earlier this week before recovering slightly to USD 58.656 per ounce on monthly gains of +0.53%, while WTI crude oil prices climbed sharply by +24.18% over the past month after weekly advances of +8.27% from geopolitical tensions and supply constraints that keep energy costs elevated globally. These commodity moves underscore how inflation expectations remain anchored in real terms rather than nominal headlines, with copper's industrial strength offsetting some of gold’s defensive appeal when equity markets falter alongside broader risk-off sentiment measured by the VIX index at 18.7 points after a recent +11.78% weekly spike that signals heightened investor anxiety despite falling fear metrics monthly (-4.05%). The S&P 500 (SPX) declined -1.67% this week amid tech sector rotation and profit-taking, yet posted positive monthly gains of +0.58%, illustrating short-term volatility around earnings reports and Federal Reserve commentary that often overshadows longer-term structural trends in gold’s valuation model where real rates dominate nominal asset returns. Bitcoin traded at USD 63,960 with a -1.95% weekly decline but maintained modest monthly gains of +2.26%, highlighting its role as an asymmetric risk-on asset rather than a traditional safe-haven substitute when geopolitical shocks escalate or central banks pivot toward easier policy conditions that favor all non-yielding assets including gold and digital tokens alike.
Upcoming Catalysts
- US Gross Domestic Product — 2026-07-30: GDP data will reveal whether growth remains resilient enough to keep rate cuts on hold, reinforcing real rates and pressuring gold lower if the figure beats expectations.
- US Non-Farm Payrolls — 2026-08-07: A strong employment report would support a hawkish Fed stance, maintaining higher borrowing costs that increase the opportunity cost of holding non-yielding spot gold.
- US Consumer Price Index — 2026-08-12: The CPI release is critical for gauging inflation persistence; any surprise uptick could delay rate cuts and boost real yields to bearish levels for XAU/USD.
- US Producer Price Index — 2026-08-13: PPI data offers an early signal of downstream cost pressures that influence core CPI trends, shaping market expectations for the trajectory of Fed policy over the next quarter.
Trading Idea
Given the current bearish market bias as price trades below the 50- and 200-day moving averages, traders should consider a short position with an entry zone between $4037–$4108 USD. A stop loss is placed above the upper Bollinger Band at $4196 USD to protect against immediate volatility-driven reversals near the local resistance level of $4765 USD. The price target for this trade is set at $3927 USD, which aligns with the lower Bollinger Band support and represents a logical extension of the ongoing downtrend structure. Investors can execute this gold analysis strategy using SPDR Gold Shares (GLD), iShares Gold Trust (IAU) on US exchanges, COMEX gold futures, or by purchasing physical bullion from authorized dealers.
Price Outlook and FAQ
Gold's expected range for tomorrow is USD $3,920 to $4,215 as the market digests weekly momentum near key technical pivots. The 1-week directional bias remains neutral-to-bearish with a test of lower Bollinger Band support likely if real rates stabilize above current levels.
Is gold currently an effective inflation hedge for US investors given recent CPI and TIPS data? With US annualized CPI at 3.73%, the erosion of purchasing power persists, yet holding non-yielding assets like gold becomes expensive when 10Y Real Rates (TIPS) sit at a robust 2.43%. The opportunity cost remains high because falling inflation alone is insufficient to trigger bull markets without simultaneous declines in real yields; currently, real rates are rising slightly rather than collapsing, which supports the neutral-to-bearish technical stance despite persistent headline inflation concerns.
How do Federal Reserve rate decisions and TIPS yields directly impact gold price movements? The Fed Funds Rate at 3.63% sets the nominal interest environment, but it is specifically real rates—captured by US 10Y Treasury Inflation-Protected Securities (TIPS)—that dictate holding costs for XAU/USD. When these real rates rise as seen recently, they increase the opportunity cost of owning gold since holders miss out on bond yields; conversely, a drop in TIPS would provide significant bullish tailwinds by lowering that non-income-generating asset's hurdle rate.
What are the primary instruments available for US investors seeking to allocate capital into physical or exchange-traded gold? US investors can gain instant exposure through SPDR Gold Shares (GLD) and iShares Gold Trust (IAU), both of which trade on the NYSE with high liquidity, while those preferring direct ownership may purchase coins from authorized dealers like APMEX, JM Bullion, or The US Mint. These vehicles allow for tax-efficient allocation strategies where GLD provides fractional shares at lower costs compared to physical premiums found in retail bullion markets.
This article is for informational purposes only and does not constitute investment advice or a financial recommendation. Investing in financial assets involves risk.
Key Takeaways for Traders
- Market Stance: The XAU/USD spot price remains technically bearish as it trades below both the 50-day and 200-day moving averages, confirming a strong downtrend despite a modest weekly gain; traders should view current rallies into the SMA 50 at $4,233.9 as potential shorting opportunities rather than bullish reversal signals until clear confirmation occurs.
- Key Technical Level: Focus on the immediate resistance near the Bollinger Band middle line and SMA 20 at USD 4,073.1 this week, while watching for a decisive break above $4,186.4 to invalidate the short-term bearish structure; conversely, any rejection from support around $3,959.8 reinforces downside pressure toward the monthly lows near $3,263.9 if broader macro headwinds persist.
- Macro Driver: Monitor the trajectory of US real interest rates measured by the 10Y Real Rate (TIPS) at 2.43%, as rising yields increase the opportunity cost for holding non-yielding gold and act as a persistent bearish fundamental driver that can offset technical weakness in USD terms; also watch Federal Reserve guidance on the pace of future rate cuts relative to inflation cooling toward the Fed’s target.
- Flow Signal: Institutional selling pressure is evident through significant ETF outflows totaling -$9,186 million last month, which contradicts any speculative bullishness seen in COT futures where non-commercial net longs rose by 2,571 contracts; this divergence highlights that retail or leveraged long positioning may be vulnerable to sharp reversals if physical demand from central banks fails to offset ETF redemptions.
- Risk Consideration: Geopolitical tensions and Middle East volatility could trigger temporary safe-haven spikes pushing gold above $4,200 even as real rates rise, but traders should maintain tight stop-losses below key support levels given that the 10Y Treasury yield is climbing toward 4.8% which dampens long-term demand for bullion in a higher-for-longer rate environment.

