Market Bias
Bearish. Gold is trading below its 20-, 50-, and 200-day moving averages while real interest rates have risen, creating a headwind for this non-yielding asset. The RSI sits at 40.4, well under the neutral level of 50, confirming downside momentum in the context of negative MACD and recent price declines that reflect both technical weakness and macro pressure from higher TIPS yields alongside a strengthening dollar index.
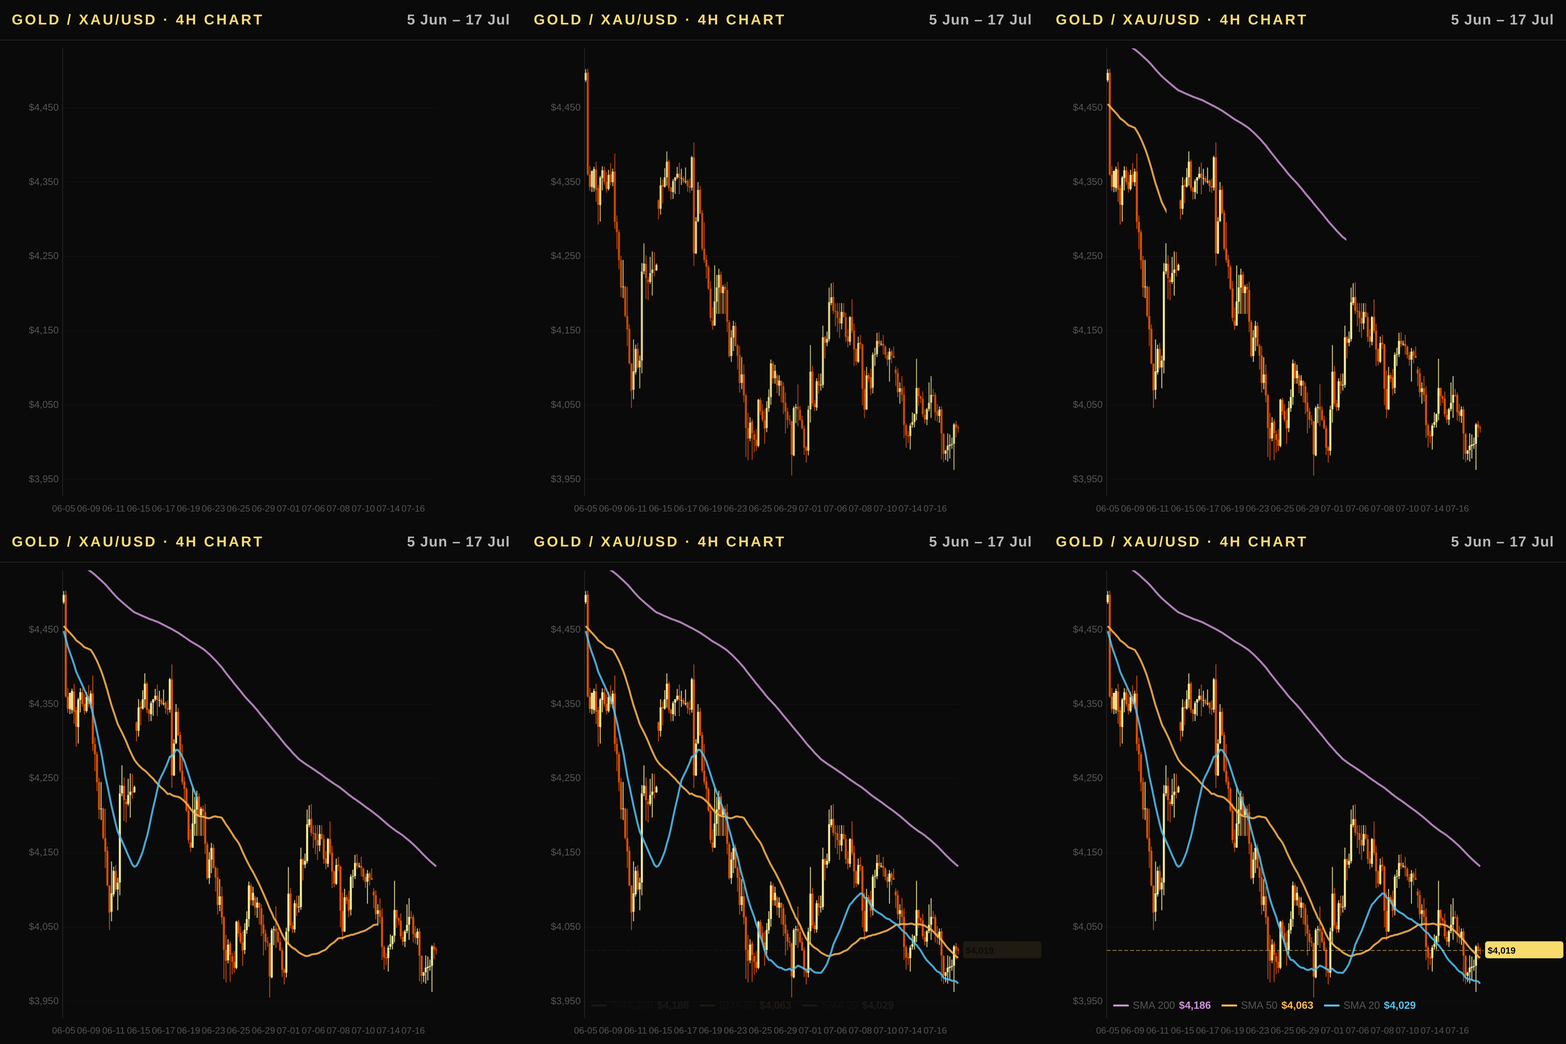
Executive Summary
The gold price today (XAU/USD) is trading at $4,012.7 in a confirmed strong downtrend, pressured by rising real yields and significant ETF outflows of nearly $9.2 billion last month. While the annual gain remains healthy at 18.23%, current technical structure shows bears dominating as price sits below all major moving averages with an RSI below the neutral 50 level. The gold price forecast points to continued weakness unless a sharp reversal in real rates or geopolitical escalation occurs, but the non-yielding asset struggles against a strengthening US dollar and higher TIPS yields.
US Outlook: Fed Policy, Real Rates, and Gold's Safe-Haven Premium
- Fed Funds Rate: The Federal Reserve has maintained its policy rate at 3.63%, a level that aligns closely with market expectations for the near term while keeping inflation pressures in check.
- Real Interest Rate Drag: With the 10Y Real Rate (TIPS) climbing to 2.35% from 2.16% year-ago, higher real yields increase the opportunity cost of holding non-yielding gold, creating a bearish headwind for spot prices in USD.
- Dollar Index Dynamics: The US Dollar Index (DXY) sits at 100.75 with a monthly gain of 1.22%; this strengthening currency raises the effective cost for foreign buyers and suppresses global demand for XAU/USD.
- Inflation Context: Annual CPI stands at 3.73%, which remains above the Fed's 2% target but has moderated from previous peaks, allowing rates to stay restrictive without triggering a sharp economic contraction.
The FOMC forward guidance suggests that rate cuts are not imminent unless inflation data shows further disinflationary momentum or growth falters significantly; this hawkish tilt supports a higher real yield environment that weighs on gold valuations over the next 1-3 months.
Technical Analysis
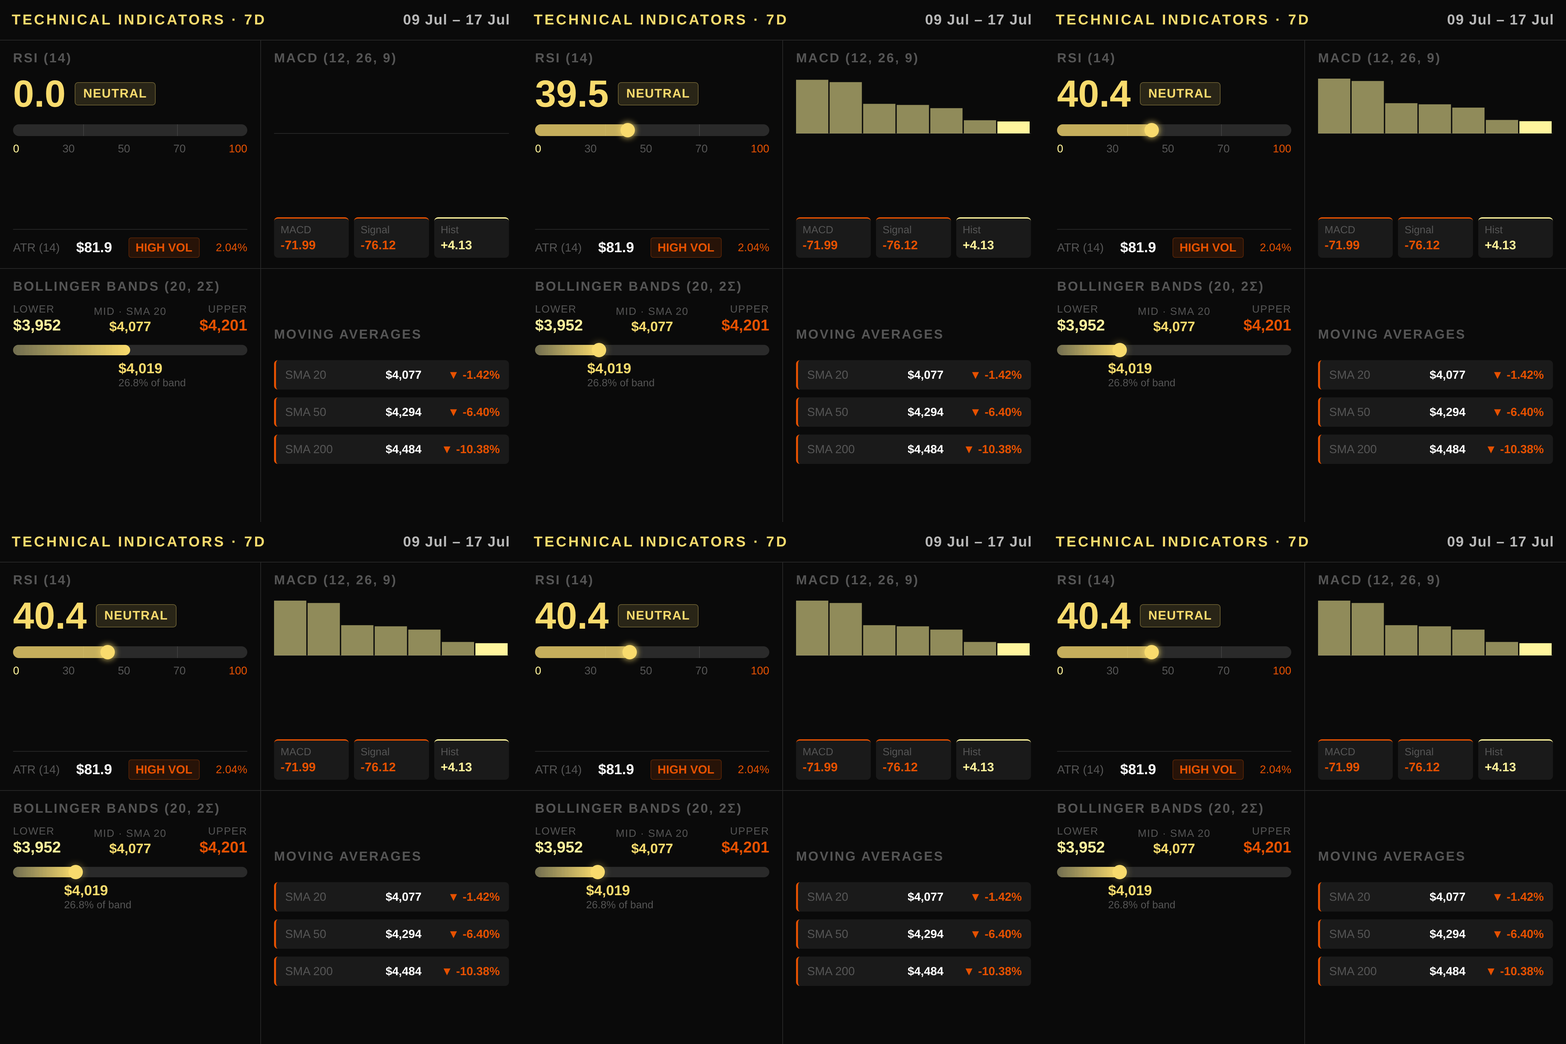
XAU/USD is currently navigating a confirmed strong downtrend, trading well below all major moving averages as price action tests critical support zones near $3962.50. The current spot gold price of $4012.7 sits beneath the SMA 20 ($4076.6), indicating immediate bearish pressure from short-term trend followers, while also remaining under the heavier resistance offered by the SMA 50 at $4293.6 and the long-term average of the SMA 200 at $4484.1. This structural alignment suggests that any bounce toward these overhead averages faces significant selling volume from institutional trend traders.
Momentum remains subdued with an RSI reading of 40.4, placing the asset in neutral-to-bearish territory just below the critical psychological level of 50, which often acts as a dynamic support floor during corrections. While the MACD line sits negative at -71.99 and is tracked by a signal line of -76.12, the positive histogram value of 4.13 hints that downside momentum may be easing slightly; however, this divergence has not yet generated a confirmed bullish crossover to invalidate the primary bearish thesis. Volatility context provided by an ATR of 81.9 indicates potential ranges for intraday swings could easily span $80–$85 around current levels without breaking into new trend territory immediately.
Bollinger Bands reflect this contraction and downward pressure, with price currently trading between the middle band at $4076.6 (SMA 20) and the lower envelope near $3952.0. The upper Bollinger Band sits at $4201.1, marking a secondary resistance zone where selling interest typically intensifies before major breakdowns occur. Key support levels are anchored at the recent consolidation floor of $3962.5 (the 60-day low), which must hold to prevent a deeper correction toward $3800–$3700; conversely, resistance is firmly established around the $4765.2 level from the 60-day high and pivot zones above $4484.
Macroeconomic Factors
The Federal Reserve maintains a policy rate of 3.63%, with market expectations pointing toward continued stability unless inflation data shows sustained deterioration. Real interest rates, measured by the 10Y Real Rate (TIPS) at 2.35%, are rising modestly due to persistent core CPI pressures; this increase elevates the opportunity cost for holding non-yielding gold and acts as a significant headwind for prices. The US Dollar Index (DXY) sits at 100.75, showing minor weekly decline but strengthening over the month — a trend that raises the effective price of gold for international buyers and dampens global demand outside the United States. Geopolitical tensions in the Middle East continue to provide a risk premium to safe-haven assets like XAU/USD, though this support is currently outweighed by macroeconomic drag from real rates and dollar strength. Central bank buying remains a structural tailwind but has slowed as emerging market central banks recalibrate reserve allocations amid shifting yield differentials. The 10Y Treasury yield at 4.47% reflects nominal bond conditions that keep funding costs elevated, further limiting gold's appeal relative to fixed-income assets offering real returns above inflation.
Positioning and Market Flows
COT data indicates a net speculative long position of 186,682 contracts in gold futures, reflecting bullish sentiment from non-commercial traders, up 6,462 contracts from the prior report despite the prevailing price decline. This positioning contrasts with the commercial sector's substantial short hedge of -214,788 contracts, which represents producer protection rather than directional bets against spot prices.
Meanwhile, ETF flows have turned distinctly bearish in June 2026 as investors reduced holdings by $9,186 million over the month alone. These significant outflows suggest a divergence between futures market optimism and actual physical demand or risk appetite among equity-linked savers who are selling gold-backed shares to rebalance portfolios toward other assets during this volatile period.
Central bank buying continues to provide structural support for spot prices even as private-sector flows turn mixed, with emerging markets maintaining robust reserves of the yellow metal amid ongoing currency debasement concerns globally.
Correlated Assets
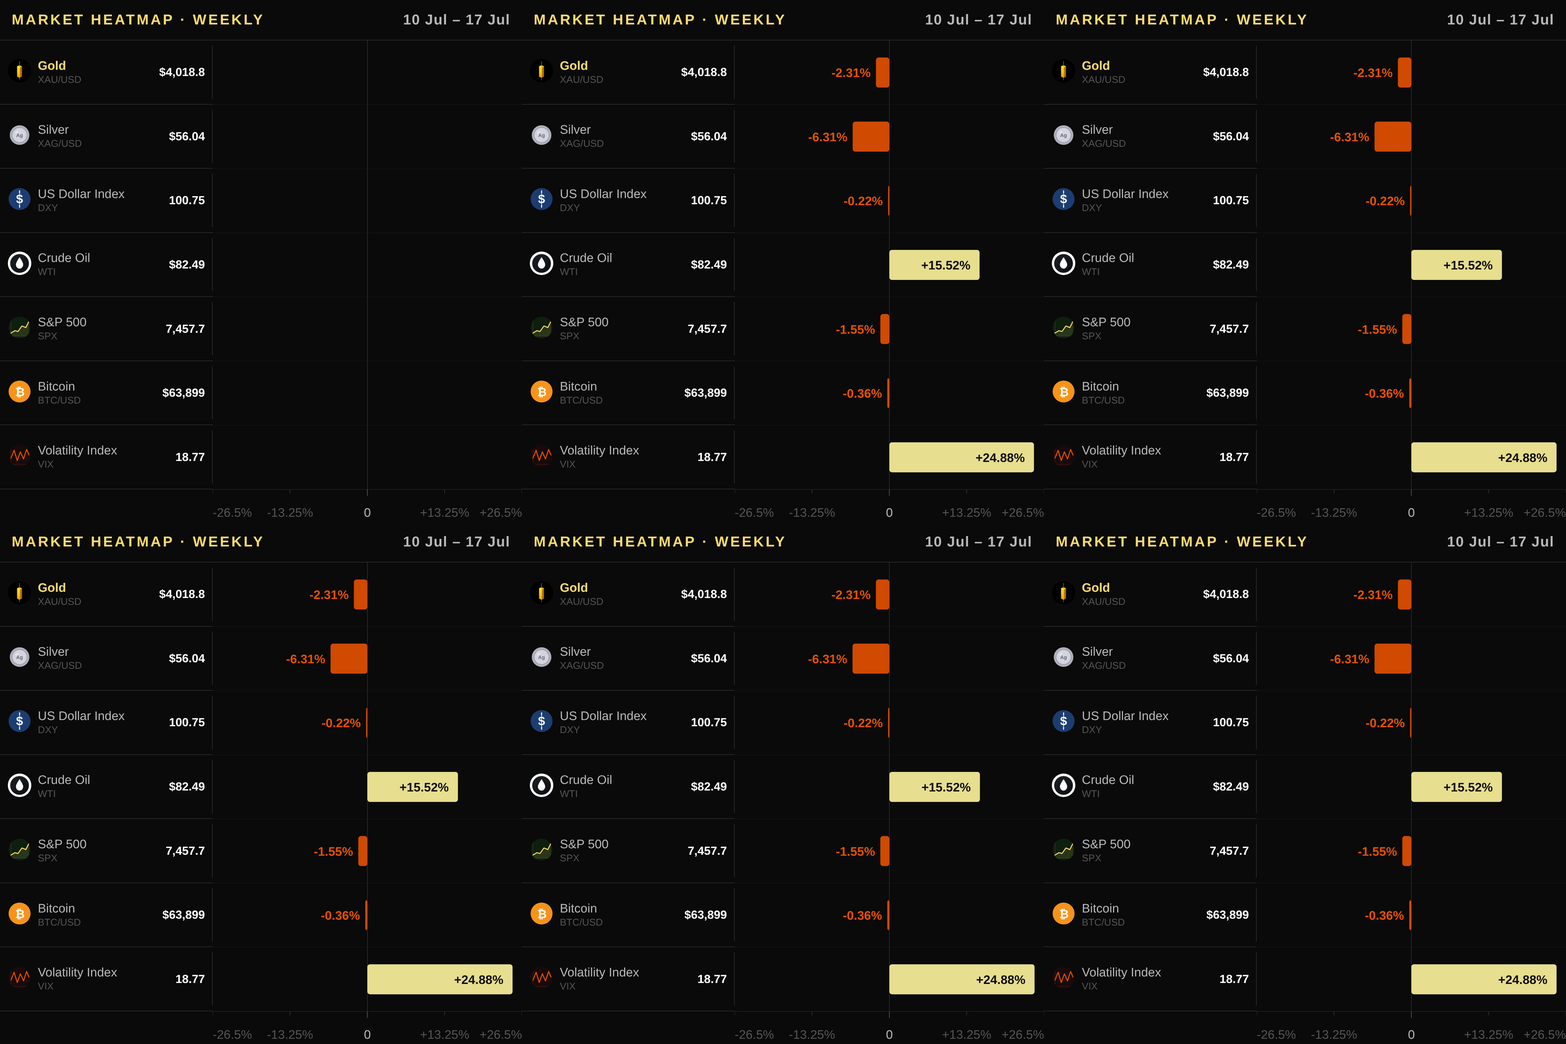
Gold’s inverse correlation with the US Dollar Index (DXY) remains intact, as a firmer dollar at 100.75 — up 1.22% over the month — raises the effective cost for non-US buyers and suppresses global demand. The yield on US Treasury bonds stands at 4.541%, and with the real rate at 2.35% the opportunity cost of holding non-yielding gold remains elevated. Copper lags behind gold with a weekly decline of -0.22% and monthly drop of -2.42%, reflecting industrial demand weakness that does not directly impact bullion prices as strongly as macro policy shifts do. Silver is underperforming significantly, down 6.31% this week and 15.42% over the month; its sharper decline highlights investor preference for gold’s store-of-value role rather than industrial exposure during rate uncertainty. The S&P 500 has fallen -1.55% weekly and -0.71% monthly, reinforcing risk-off dynamics that typically boost demand for non-correlated assets like XAU/USD. Oil prices have surged to $82.49 per barrel with a +15.52% weekly gain driven by geopolitical tensions in the Middle East; this reinforces gold’s role as an inflation hedge even when real rates remain elevated at 2.35%. Bitcoin has gained momentum, rising 6.88% over the last month to $64,148.39, but it remains untested for safe-haven credibility compared to physical precious metals during systemic stress events. The VIX volatility index is up sharply by +24.88%, signaling elevated fear levels that historically support gold’s defensive appeal despite its current technical weakness below key moving averages.
Upcoming Catalysts
- US Gross Domestic Product — 2026-07-30: This release will provide crucial insight into economic momentum, with any shift in growth expectations influencing Federal Reserve policy and real interest rate trajectories that directly impact gold's opportunity cost.
- US Non-Farm Payrolls — 2026-08-07: Stronger-than-expected hiring data could reinforce the case for a higher-for-longer monetary stance, dampening bullish sentiment for non-yielding assets like spot gold price.
- US Consumer Price Index — 2026-08-12: Inflation readings will be closely monitored to gauge pressure on Fed funds rate decisions; persistent CPI above expectations would increase the cost of holding XAU/USD.
- US Producer Price Index — 2026-08-13: Wholesale inflation data acts as a leading indicator for consumer prices, offering early signals that could alter market positioning before official reports are released.
Trading Idea
A short position in XAU/USD is recommended with an entry zone between $4012 and $4076, aligning with the current bearish technical structure where price trades below the 50- and 200-day moving averages. Place a stop loss above the SMA 20 at approximately $4108 to protect against potential volatility spikes or a failed breakout from immediate overhead resistance. The primary target is set near the recent support level around $3962, where downside momentum should find additional fuel given the strong downtrend and elevated real yields. Investors can execute this strategy using SPDR Gold Shares (GLD) or iShares Gold Trust (IAU) on US exchanges, COMEX gold futures for leveraged exposure, or by purchasing physical bullion from reputable dealers like APMEX or JM Bullion.
Price Outlook and FAQ
Gold is expected to trade in a USD $3,950–$4,120 range tomorrow as consolidation continues below all moving averages, while the 1-week directional bias remains bearish with key resistance at SMA-20 ($4,076.6) acting as immediate overhead pressure and support near USD $3,962.5 holding for buyers attempting to defend this zone against further downside momentum driven by rising real rates.
Is gold a good inflation hedge for US investors right now? Given the current annual CPI of 3.73% combined with a 10Y Real Rate (TIPS) yield of 2.35%, holding non-yielding gold carries an opportunity cost that may limit its effectiveness as a pure inflation shield in this specific environment. While gold has gained significantly over the long term, real rates currently stand above zero which historically acts as a headwind for spot prices compared to periods where TIPS yields are negative or near-zero.
How do Fed rate decisions and real rates affect gold prices? The Federal Reserve's stance on interest rates directly impacts the 10Y Real Rate (TIPS), which determines the opportunity cost of holding non-yielding assets like gold; rising real rates increase this cost, creating a bearish pressure that often outweighs inflation concerns in the short term. Conversely, any shift toward lower nominal rates or higher inflation expectations that outpace rate hikes would push TIPS yields down and provide tailwinds for XAU/USD prices to rally from current levels of $4012.7.
How can US investors buy gold? US residents primarily access the market through exchange-traded funds like SPDR Gold Shares (GLD) or iShares Gold Trust (IAU) traded on the NYSE, which offer fractional share ownership and liquidity for those preferring paper assets without storage responsibilities. Alternatively, investors seeking physical bullion can purchase coins and bars directly from authorized dealers such as APMEX, JM Bullion, or the US Mint to hold tangible reserves within their personal safe deposit boxes or home safes.
This article is for informational purposes only and does not constitute investment advice or a financial recommendation. Investing in financial assets involves risk.
Key Takeaways for Traders
- Market Stance: The gold market is currently bearish as price trades below all major moving averages and RSI sits at 40.4 within a strong downtrend, suggesting sellers should maintain control until signs of stabilization emerge near the $3962.5 support zone.
- Technical Level to Watch: Traders must monitor the critical breakdown level at USD 3962.5 this week; any sustained close below this threshold confirms further downside momentum toward deeper corrections in XAU/USD.
- Macro Driver: The primary fundamental headwind remains real interest rates, which are rising as TIPS yields move higher to 2.35%, increasing the opportunity cost for holding non-yielding gold and pressuring prices lower.
- Flow Signal: Institutional sentiment is negative given significant monthly ETF outflows of $-9,186 million combined with a speculative COT report showing net long positions that fail to offset bearish structural selling pressure from producers.
- Risk Consideration: Investors should hedge against geopolitical risk-off premiums which could temporarily support spot gold despite the prevailing technical weakness and dollar strength observed in the US Dollar Index (DXY).

