Market Bias
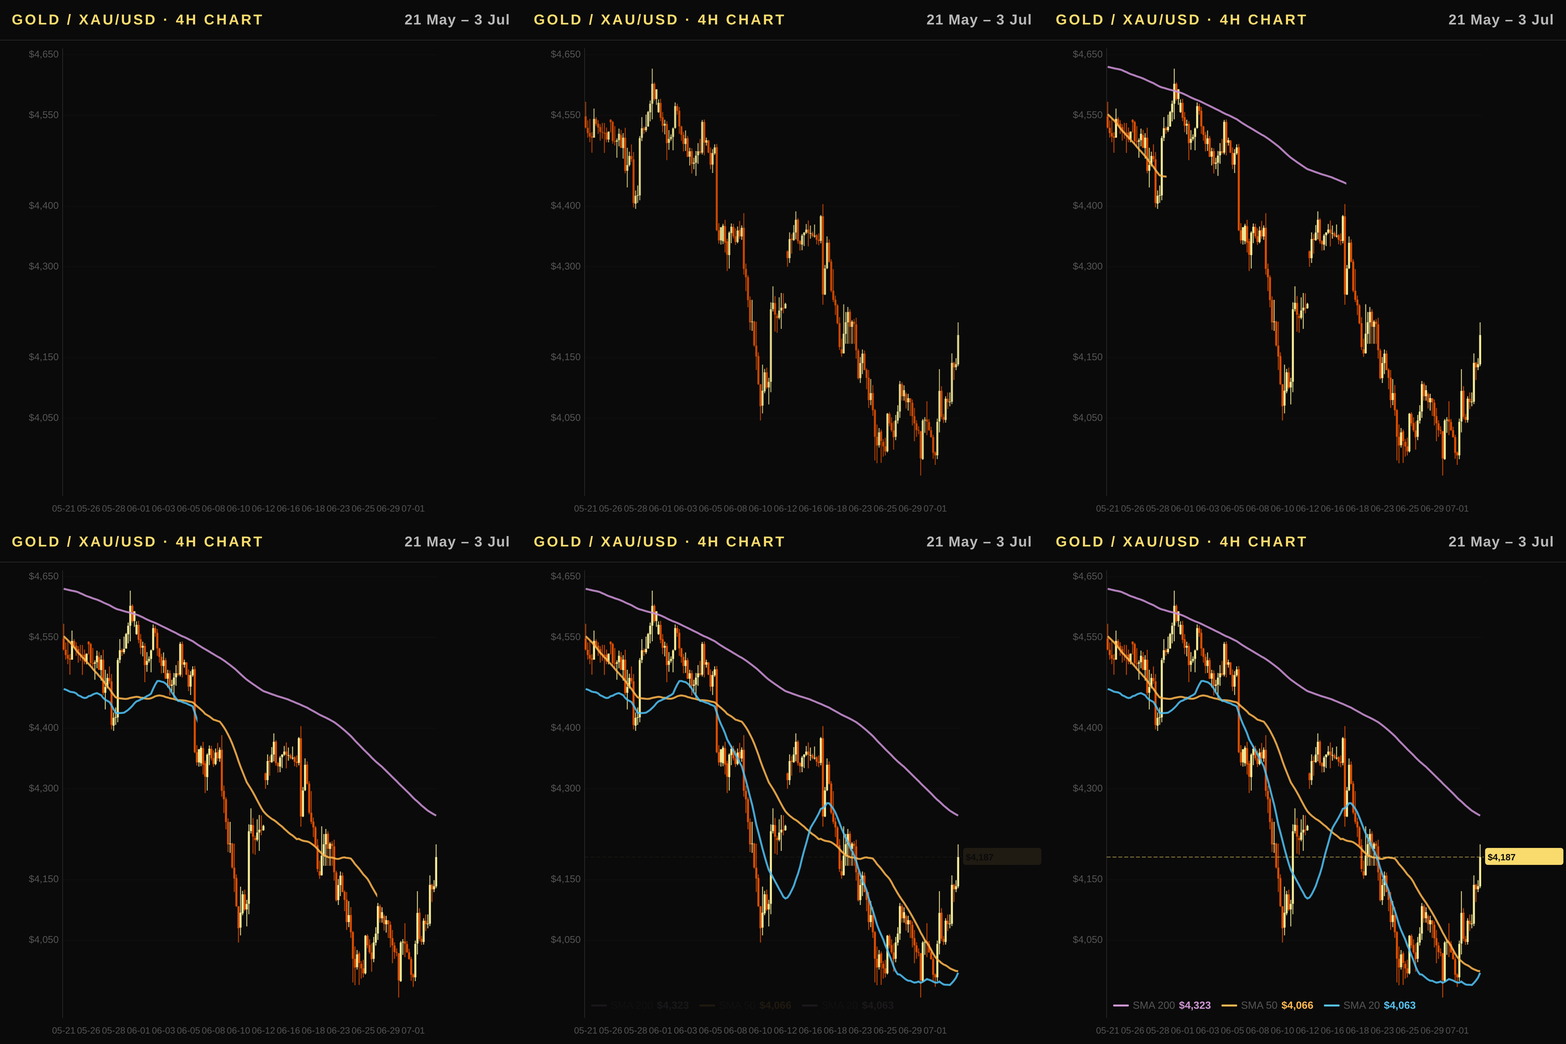
Bearish – XAU/USD is trading below both the 50-day ($4,404) and 200-day ($4,471) moving averages while the MACD line remains negative at -95.25 (histogram +12.99); despite a recent weekly gain of 2.66%, the longer-term downtrend structure persists as price fails to reclaim key overhead resistance near $4,880.
Executive Summary
The gold price today (XAU/USD) stands at $4,187.30 in a technical strong downtrend despite gaining 2.66% over the past week and posting solid year-to-date returns of 26.44%. While speculative positioning remains bullish according to COT data with net non-commercial longs up by 27,079 contracts, ETF holdings have declined by $1,969 million recently, creating a notable divergence between futures sentiment and spot capital flows. This gold price forecast suggests volatility as the market digests rising real rates driven by TIPS yields at 2.25%, which increase the opportunity cost of holding this non-yielding asset against Federal Reserve policy hovering near 3.63%.
US Outlook: Fed Policy, Real Rates, and Gold's Safe-Haven Premium
- Fed policy trajectory: The Federal Reserve Funds Rate stands at 3.63%, holding steady in a range that market expectations suggest remains restrictive relative to historical norms for non-yielding assets like gold.
- Real rates impact: With the 10Y Real Rate (TIPS) rising to 2.25% from prior levels, the opportunity cost of holding XAU/USD has increased significantly, creating a persistent bearish headwind for spot gold prices despite its safe-haven status.
- Dollar dynamics: The US Dollar Index (DXY) is trading at 100.86 after a monthly gain of 1.65%, which suppresses global demand by raising the effective cost for international buyers outside of USD-denominated markets.
- Forward guidance implications: Recent FOMC minutes suggest a cautious approach to easing, with no immediate pivot anticipated that would lower real yields rapidly enough to reverse current downward pressure on gold price forecasts over the next quarter.
Technical Analysis
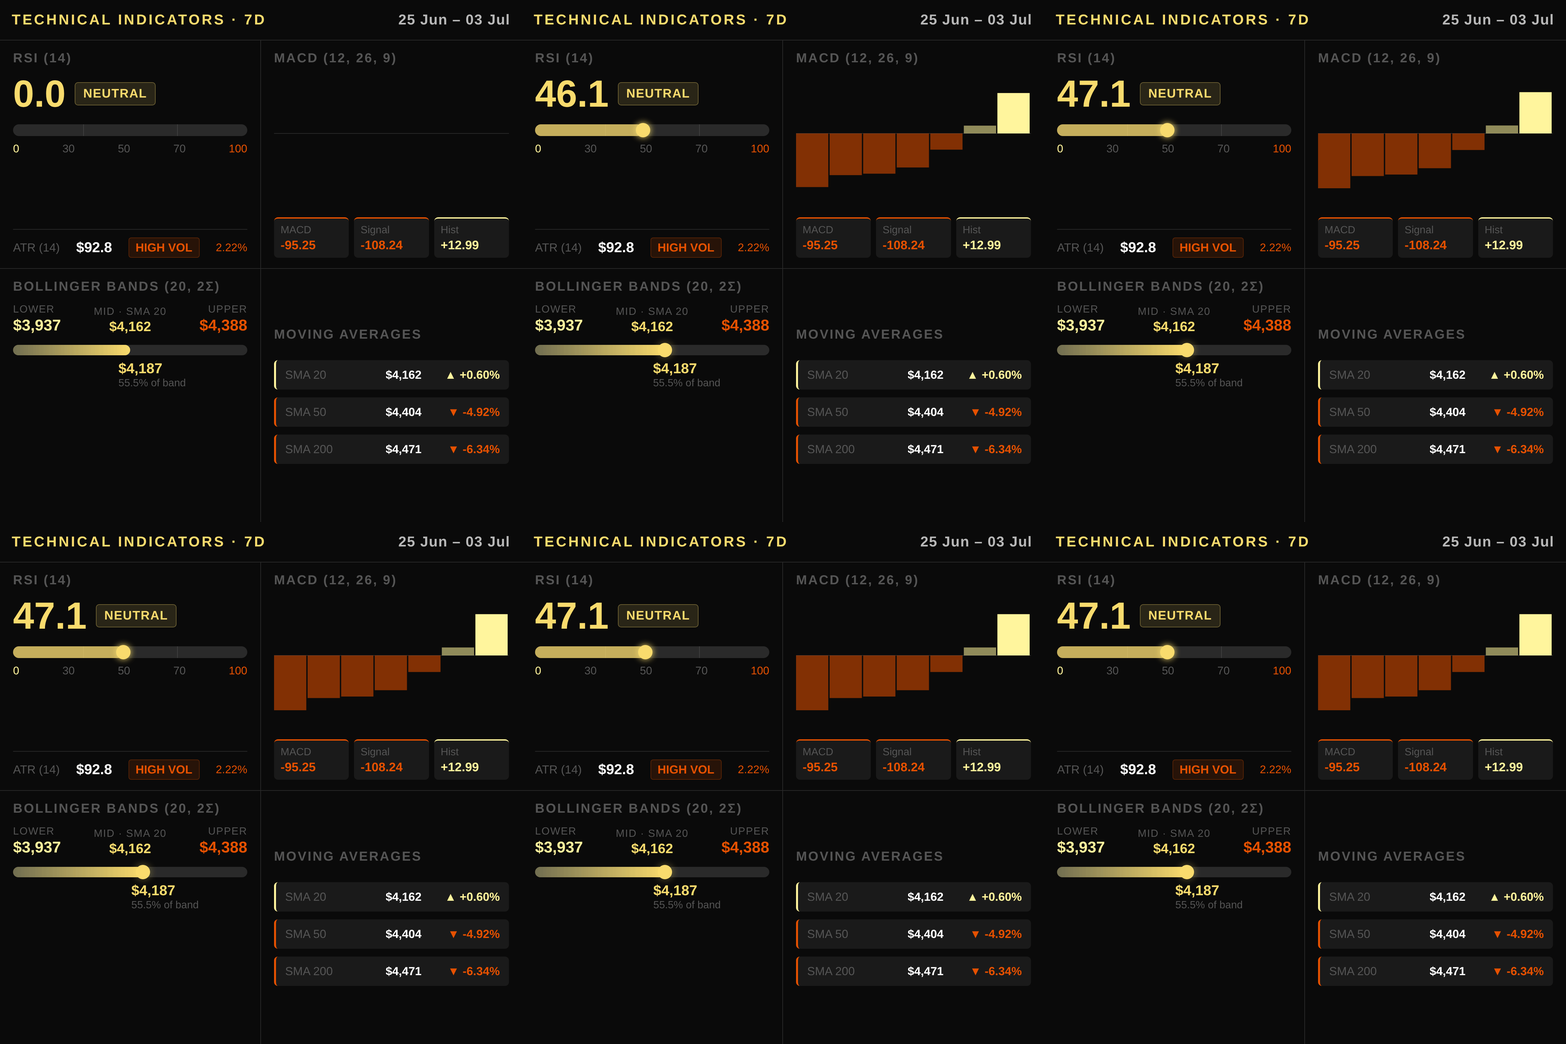
XAU/USD is currently navigating a strong downtrend, trading at $4187.3 in USD while hovering just above the 20-day moving average of $4162.4. This price action suggests immediate support near the Bollinger Band middle line, though the broader structure remains bearish as the spot gold price sits well below both the SMA 50 at $4404.1 and the critical long-term benchmark of the SMA 200 at $4470.7. These overhead moving averages act as significant resistance levels that must be breached to validate a trend reversal for this gold price forecast.
The RSI indicator sits at 47.1, positioning the spot gold price in neutral-to-slightly-bearish territory rather than oversold conditions, which limits immediate bounce potential near current support zones. Momentum is confirmed weak with the MACD line registering -95.25 against a signal line of -108.24. Despite the histogram showing a modest bullish reading of 12.99, indicating a slight slowing in selling pressure, the dominant trend remains negative as long as price fails to reclaim higher levels.
Volatility has compressed with an ATR value of 92.8 USD per ounce, suggesting that sharp moves are likely until the market finds a new equilibrium following this month's correction. Key support is established at the 60-day low of $3962.5, while primary resistance lies near the 60-day high of $4879.7. A sustained break above $4250 USD would be required to challenge the SMA 20, but failure here reinforces the bearish bias for this XAU/USD analysis.
Macroeconomic Factors
The Federal Reserve's policy stance remains a primary driver for gold, with the Fed Funds Rate currently at 3.63%. This nominal rate sits alongside rising inflation data, as annual CPI stands at 4.27%, which influences market expectations for future monetary easing. Crucially, real interest rates determine holding costs for this non-yielding asset; the 10Y Real Rate (TIPS) has increased to 2.25% from 2.17%. This upward drift in real yields tightens the opportunity cost of gold, creating a structural headwind that suppresses prices despite its safe-haven appeal. A stronger US Dollar Index (DXY at 100.86) further complicates demand dynamics by making XAU/USD more expensive for non-US buyers, effectively dampening global appetite even when geopolitical tensions rise in the Middle East.
Positioning and Market Flows
COT report data for XAU/USD (gold) futures reveals a speculative bias turning bullish, with non-commercial net longs rising by 27,079 contracts to reach 181,339 over the past five weeks. This accumulation of long positions indicates growing institutional confidence in gold's recovery potential despite broader market headwinds.
Conversely, ETF flows remain a significant drag on sentiment this month, with funds reducing holdings by approximately $2 billion as investors rotate into higher-yielding assets or hedge against inflation fears using equities. These outflows reflect near-term profit-taking and reduced appetite for the non-yielding asset in a rising-rate environment, even though central bank demand continues to provide structural support at lower price levels globally.
Central banks have sustained buying pressure over recent years, absorbing significant supply from producers and ETF sellers alike. While this institutional demand prevents deeper drawdowns during corrections, private sector flows currently suggest caution ahead of upcoming Fed data releases that could alter rate-cut expectations or real yields in the near term.
Correlated Assets
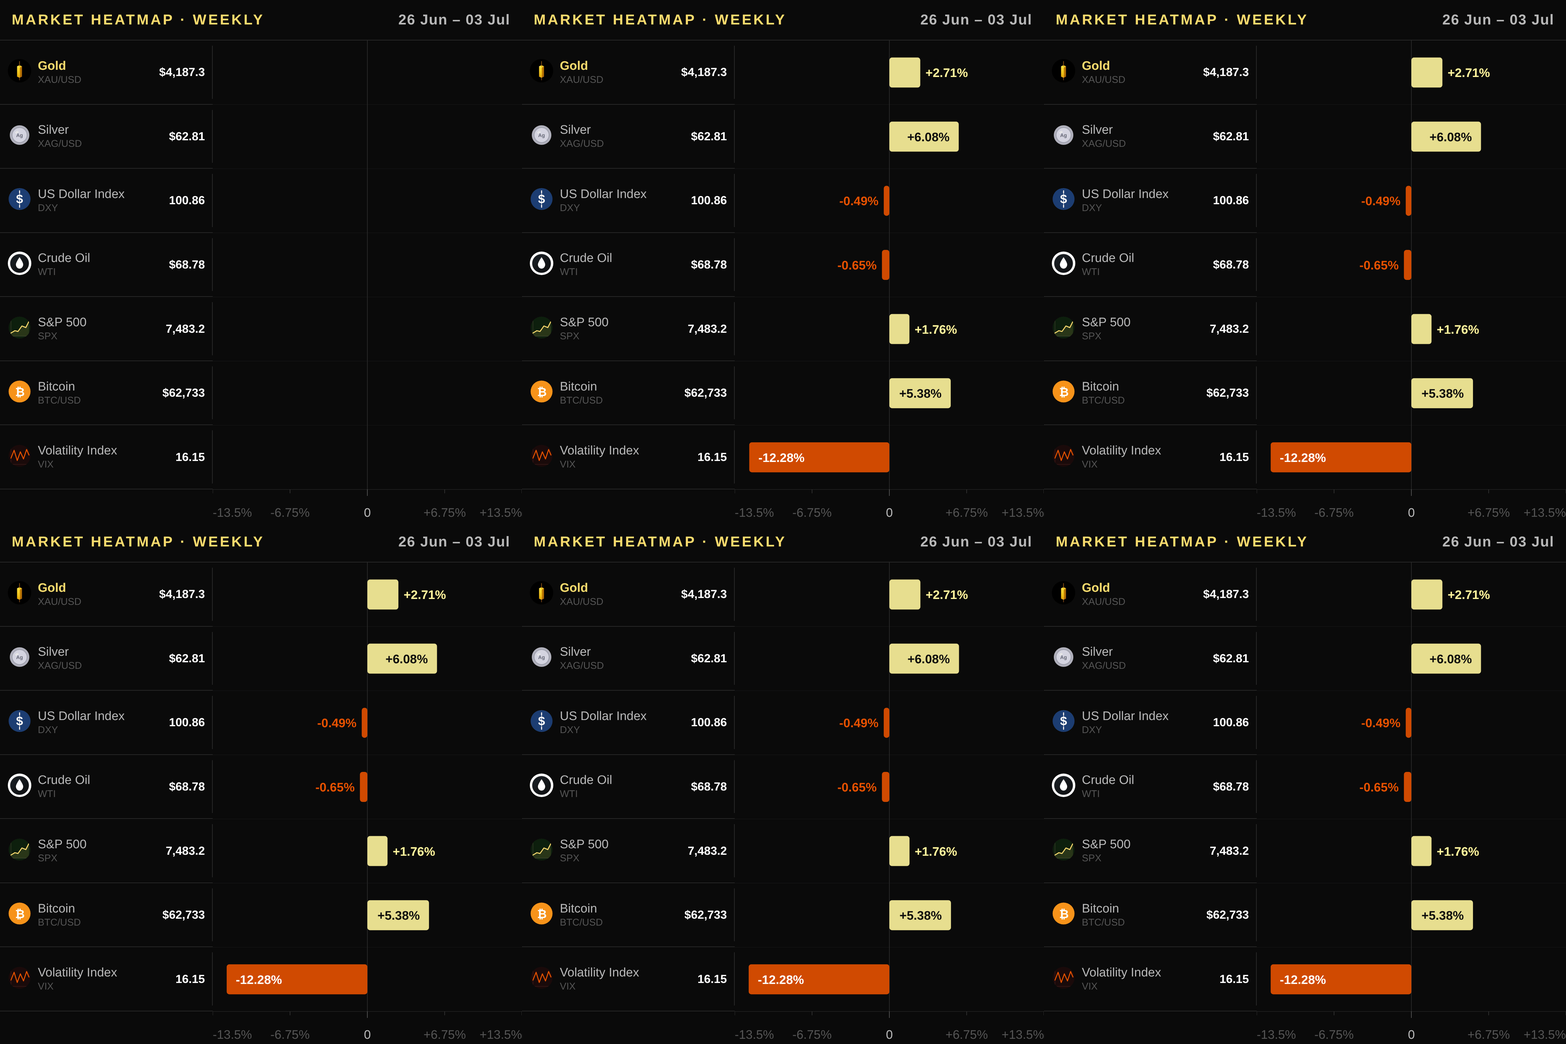
Gold's inverse relationship with the US Dollar Index (DXY) remains intact, as a weaker dollar typically lifts global demand for spot gold price assets; currently, DXY sits at 100.86 and is down slightly on a weekly basis of -0.56%, offering modest support to XAU/USD despite its monthly rise of 1.65%. Rising yields on the US 10Y Treasury note (US10Y) increase gold's opportunity cost as a non-yielding asset, with rates at 4.485% and showing weekly strength via +2.12%, which exerts bearish pressure despite a narrowing yield curve spread of only 0.36%. Copper futures trade at USD 6.224/lb; its mixed performance (weekly gain of +1.34% but monthly decline of -4.41%) reflects divergent global supply-demand dynamics that do not directly dictate gold's path in the short term. Silver, often called "poor man's gold," trades at USD 62.815/oz and has rallied weekly (+6.08%), but its sharp monthly drop of -14.86% highlights volatility within precious metals that can diverge from gold's broader trend. The S&P 500 index (SPX) stands at 7483.24, with a volatile recent trajectory marked by weekly gains (+1.71%) offsetting monthly losses (-1.66%), suggesting equities remain resilient yet sensitive to Fed policy shifts that could alter the risk premium for gold. The VIX fear gauge sits low at 16.15 and has fallen sharply this week (-14.51%), indicating subdued market anxiety, though its longer-term trend shows a monthly increase (+2.41%) that implies underlying uncertainty remains priced in over time. WTI crude oil prices have weakened significantly, trading at USD 68.78/barrel after recording a weekly decline of -0.65% and an alarming monthly drop of -26.07%, which could dampen inflation expectations but may also signal recessionary risks that support gold's safe-haven status if geopolitical tensions persist. Bitcoin, the largest digital asset by market capitalization, trades at USD 62,732.69 and has gained +4.31% this week; while it posted a modest monthly decline of -1.28%, its performance relative to other volatile markets does not constitute a direct alternative allocation for conservative gold investors seeking stability in times of geopolitical stress or monetary policy uncertainty.
Upcoming Catalysts
- CPI Release — 2026-07-14
- PPI Release — 2026-07-15
- GDP Report — 2026-07-30
Trading Idea
Given the strong downtrend and price trading below both the 50- and 200-day moving averages, investors should execute a short position on XAU/USD with an entry zone between $4137 and $4236. A stop loss is placed at $4398 to protect against a breakout above the upper Bollinger Band acting as immediate resistance. The primary target for this trade is set at $3950, which aligns with the 60-day low support level where further downside momentum could accelerate if real rates remain elevated. US investors can implement this bearish view by selling gold via SPDR Gold Shares (GLD) or iShares Gold Trust (IAU), utilizing COMEX gold futures for direct leverage, or taking short positions on physical allocations through authorized US dealers.
Price Outlook and FAQ
Gold is expected to trade within a range of USD 4,036–USD 4,338 tomorrow as volatility remains contained near current levels. The weekly directional bias leans bearish toward the SMA 50 resistance at $4,404 before testing stronger overhead supply zones.
Is gold currently an effective inflation hedge for US investors given recent CPI data? With annual CPI tracking at 4.27%, headline inflation remains elevated enough to erode purchasing power while real interest rates measured by the 10Y TIPS yield have risen to 2.25%. This combination increases the opportunity cost of holding non-yielding gold, creating headwinds that typically outweigh its traditional safe-haven appeal over short horizons.
How do Federal Reserve rate decisions and real yields impact XAU/USD price movements? Gold prices are inversely correlated with rising real rates; when the Fed Funds Rate stays at 3.63% or if TIPS yields climb, bond returns become more attractive compared to holding a non-income-generating asset like gold. Consequently, any FOMC signal suggesting higher-for-longer rates reinforces a bearish outlook for spot gold price action in USD terms.
What are the primary instruments available for US investors seeking exposure to physical or exchange-traded bullion? Investors can gain immediate access via SPDR Gold Shares (GLD) and iShares Gold Trust (IAU) listed on NYSE, though these represent paper claims rather than direct ownership of metal. For those preferring tangible assets, purchasing coins or bars from authorized dealers like APMEX, JM Bullion, or the US Mint offers secure physical holdings without brokerage commissions for most platforms.
This article is for informational purposes only and does not constitute investment advice or a financial recommendation. Investing in financial assets involves risk.
Key Takeaways for Traders
- Market Stance: The XAU/USD trend is bearish as price trades below both the SMA 50 and SMA 200 with RSI at neutral levels, suggesting traders should look for short opportunities on rallies toward overhead resistance zones rather than chasing dips in this strong downtrend structure.
- Technical Level to Watch: The primary pivot point remains the $4162.4 SMA 20 support line; a decisive break below this level could accelerate downside momentum toward the next lower structural floor at $3962.5 as selling pressure intensifies in USD terms.
- Macro Driver: Monitor rising real rates driven by TIPS yields near 2.25% and persistent CPI inflation of 4.27%, which increase opportunity costs for holding gold while a strengthening DXY further suppresses global demand for the non-yielding metal.
- Flow Signal: Be cautious regarding massive ETF outflows totaling $-1,969 million this month alongside rising speculative net longs in COT reports that may indicate contrarian positioning or potential exhaustion of buying interest before further correction.
- Risk Consideration: Geopolitical tensions and sharp declines in WTI oil remain key safe-haven catalysts to monitor; however, these factors must be weighed against the dominant bearish technical setup where a sudden spike in volatility could trigger stop-losses if price fails to reclaim overhead moving averages quickly.

