Market Bias
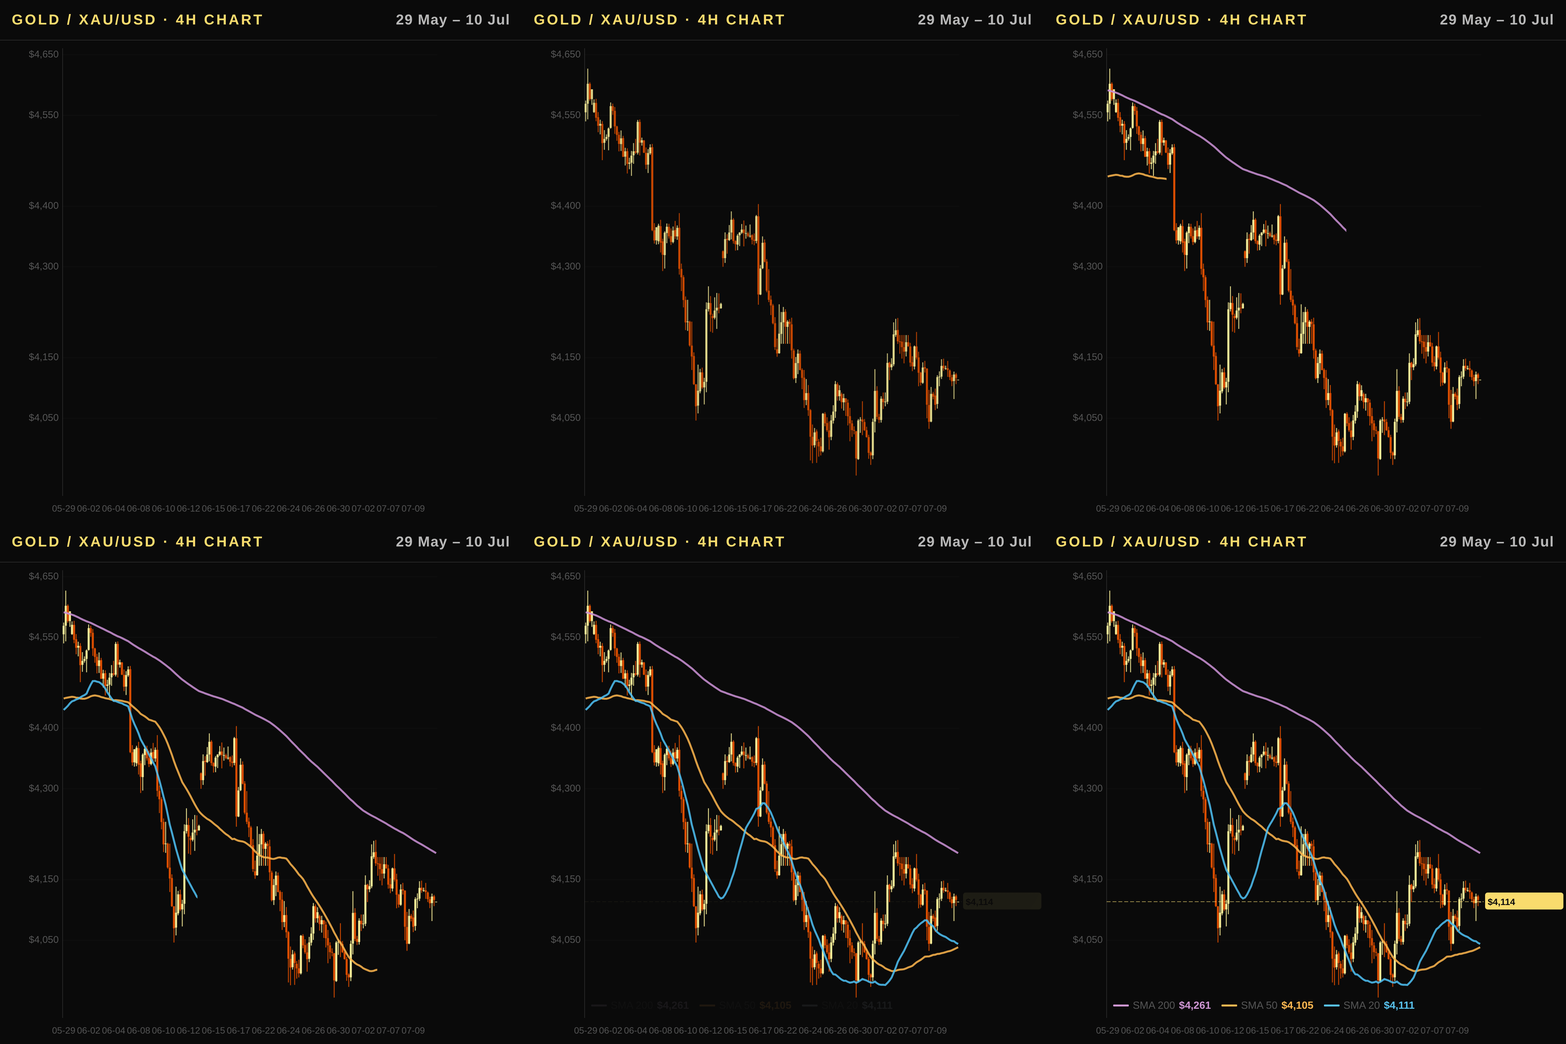
Bearish: Gold is trading in a confirmed strong downtrend, currently below its 20-, 50- and 200-day moving averages while RSI sits at 43.7 within bearish territory below the neutral level of 50. The negative MACD line reinforces downward pressure despite a marginally positive histogram that signals only limited slowing in selling momentum. A recent weekly decline of -1.76% highlights the dominance of bears, with further downside likely until price action rebuilds above the key overhead resistance near $4355 and confirms trend reversal to neutral or bullish bias
Executive Summary
Gold price today (XAU/USD) is trading at $4,113.70 amid a strong downtrend driven by elevated real interest rates and sustained ETF outflows. The current XAU/USD analysis reflects bearish momentum as the spot gold price has slipped 1.76% over the past week despite persistent central bank demand. With the US Dollar Index near 101, global investors face higher opportunity costs for holding this non-yielding asset while real yields remain firm at 2.31%. This gold price forecast suggests caution ahead of upcoming inflation data that could either reinforce restrictive Fed policy or open a path to rate cuts within two months.
US Outlook: Fed Policy, Real Rates, and Gold's Safe-Haven Premium
- The Federal Reserve Funds Rate remains steady at 3.63%, with market expectations for a pause aligning closely with current policy as investors weigh persistent inflation data against slowing growth indicators.
- While the nominal US 10Y Treasury Yield sits at 4.47%, it is crucial to distinguish this figure from real rates; the actual benchmark impacting gold opportunity cost is the 10Y Real Rate (TIPS) of 2.31%, which has stabilized and poses a moderate, rather than severe, headwind for non-yielding assets like XAU/USD.
- A strengthening US Dollar Index (DXY) at 100.97 increases the effective cost for foreign buyers holding gold in USD, thereby suppressing global demand despite recent geopolitical tensions that often boost safe-haven flows.
- Forward guidance from the most recent FOMC statement suggests a data-dependent approach to rate cuts over the next 1–3 months, implying volatility will persist until real rates clearly begin their downward trajectory.
- Annual US CPI inflation remains elevated at 4.27%, reinforcing the Fed’s caution against premature easing and keeping pressure on gold prices through higher opportunity costs relative to fixed-income alternatives.
Technical Analysis
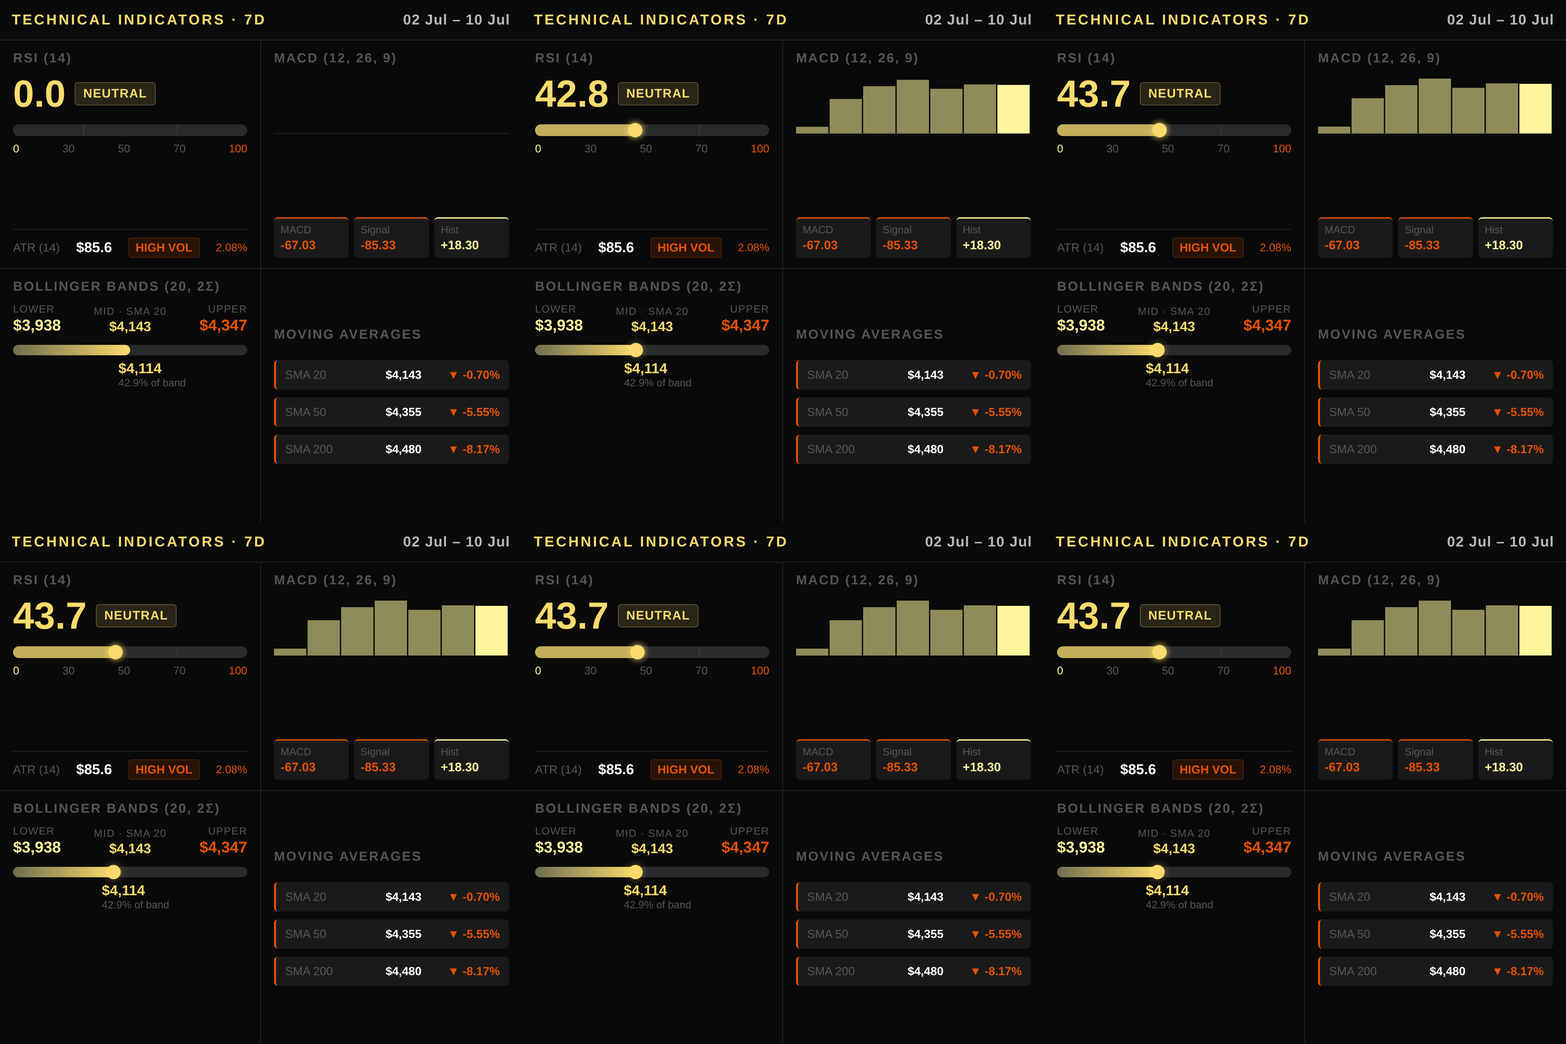
XAU/USD is currently trading at $4,113.70 within a confirmed strong downtrend structure against its primary moving averages. The spot gold price sits just below the 20-day Simple Moving Average (SMA) of $4,142.8, which acts as immediate overhead resistance and confirms short-term bearish momentum. Price remains significantly detached from longer-term support found at the 50-day SMA ($4,355.3) and even more so below the critical 200-day average ($4,479.9), indicating a sustained correction phase rather than a minor retracement. The Relative Strength Index (RSI) registers 43.7, positioning gold in neutral-to-bearish territory well below the psychological level of 50; while not yet oversold, this reading suggests limited immediate bounce potential unless real rates pivot sharply lower. Momentum is further confirmed by the MACD histogram at +18.3, which remains positive despite bearish line crossovers, signaling a slight cooling in selling pressure but failing to generate a robust bullish reversal signal yet. Volatility context provided by the Average True Range (ATR) of 85.6 suggests daily fluctuations are roughly 2% to 3%, implying that significant moves away from current levels will require substantial catalysts or volume surges. Bollinger Bands frame the price action between an upper band at $4,347.3, a middle band aligning with the SMA 20 at $4,142.8, and a lower support zone near $3,938.2. Key technical resistance is anchored by the 60-day high at $4,811.0, while immediate floor support lies near the monthly low of $3,962.5. The failure to reclaim the SMA 50 reinforces the bearish bias for this week’s gold price forecast, as sellers continue to push spot prices toward the lower Bollinger Band before any potential stabilization can occur.
Macroeconomic Factors
The path of gold is currently defined by a tug-of-war between elevated real yields and geopolitical safe-haven demand, with central bank policy playing a decisive role in determining the asset's trajectory. The Federal Reserve has maintained its benchmark rate at 3.63%, keeping the nominal 10Y Treasury Yield anchored near 4.47%. However, investors must focus on the 10Y Real Rate (TIPS) of 2.31% to gauge gold’s true opportunity cost; rising real rates increase this cost and pressure prices lower, while falling yields provide a bullish tailwind. The yield curve remains normal with a positive spread between the 10-year and 2-year Treasury notes, indicating no immediate recessionary signal from bond market expectations alone.
A stronger US Dollar Index (DXY) at 100.97 creates headwinds for gold by making it more expensive for foreign buyers to purchase the non-yielding metal in global markets. Conversely, a weakening dollar would lower its effective price and stimulate international demand. While inflation remains sticky at an annual rate of 4.27%, providing some cushion against recession fears, the Federal Reserve’s forward guidance suggests rates will remain higher for longer unless economic data deteriorates sharply. This stance prevents real rates from falling significantly in the near term, capping upside potential despite gold's structural role as a hedge against currency debasement and geopolitical instability.
Positioning and Market Flows
The latest COT report for gold futures indicates a net long speculative position of 194,246 contracts, reflecting continued bullish sentiment from large institutional speculators despite recent price pullbacks. This increase in non-commercial longs over the past five weeks suggests growing interest among hedge funds as investors seek protection against geopolitical instability and persistent inflationary pressures.
In contrast to futures positioning, ETF holdings have seen a net outflow of approximately $1,970 million this month, signaling that some institutional capital is rotating away from liquid gold exposure or taking profits after the year-to-date rally. This divergence between rising COT longs and negative ETF flows highlights a potential split in investor strategy where traders favor futures for leverage while long-term holders trim physical-equivalent positions.
Central bank demand continues to provide structural support, with emerging market nations accumulating reserves amid de-dollarization trends. While this multi-year buying spree does not appear directly reflected in weekly COT data, it underscores the broader institutional conviction that gold remains a critical portfolio component despite short-term volatility driven by Fed policy and real rate dynamics.
Correlated Assets
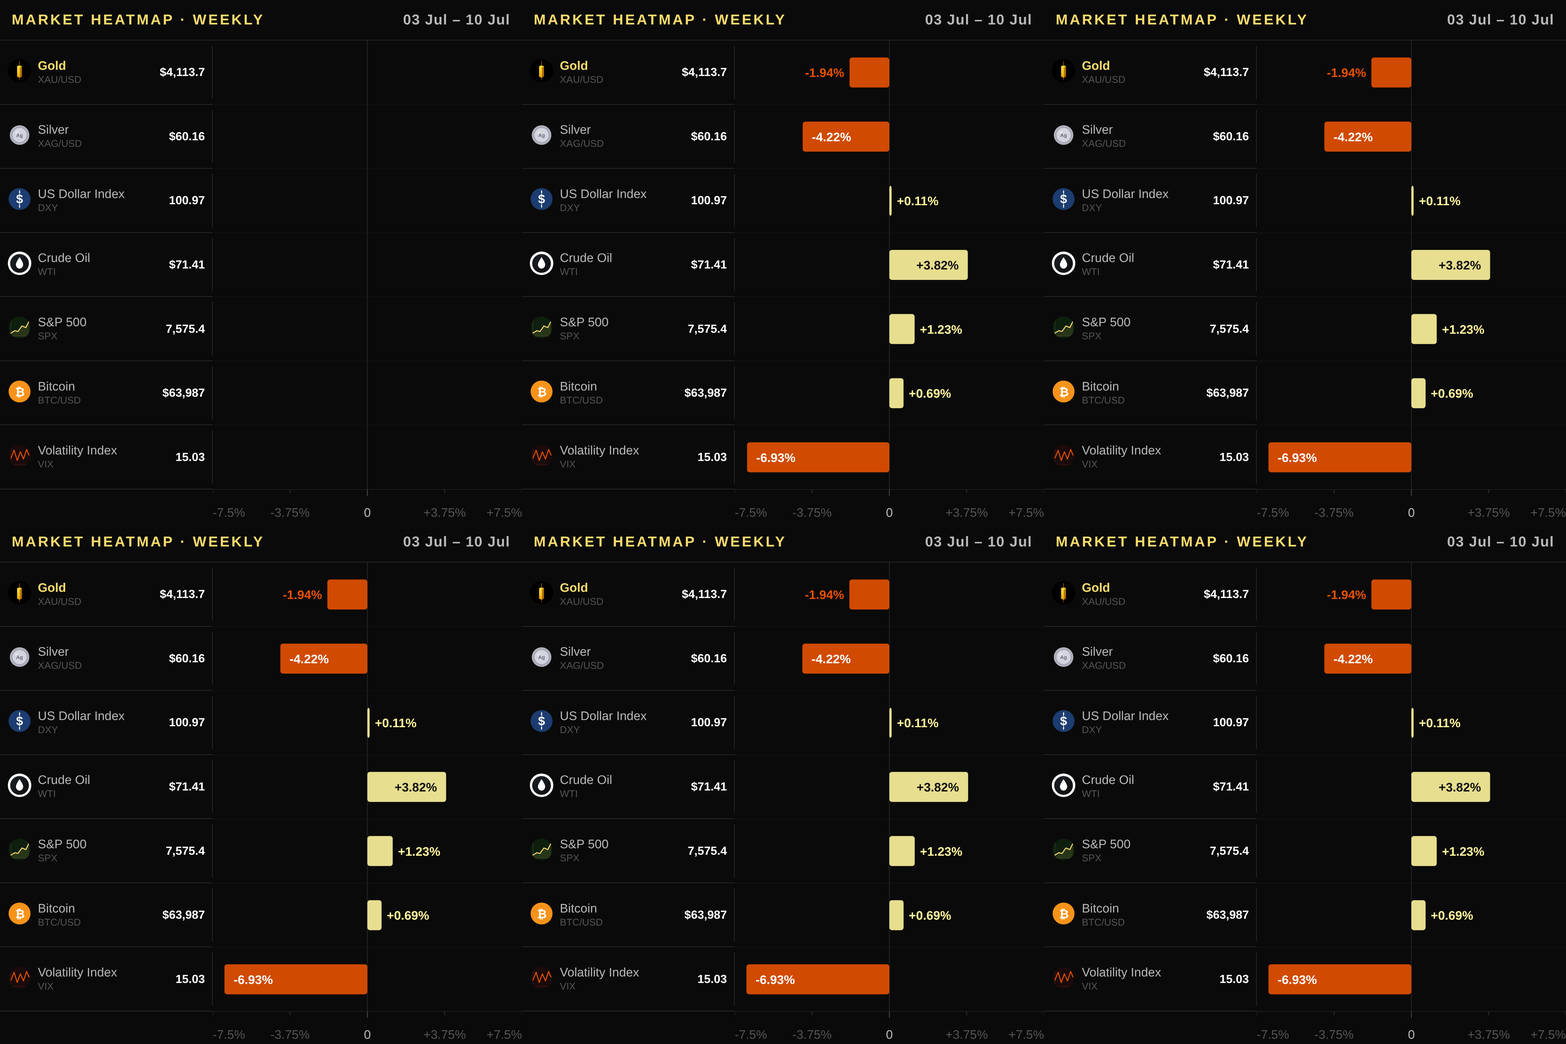
Gold’s inverse relationship with the US Dollar Index (DXY) remains intact as the greenback edges higher at 100.97, though its weekly gain of just 0.11% offers limited immediate pressure on spot gold. The yield curve stays normal with a positive 10Y-2Y spread of 0.35%, which supports bearish sentiment for non-yielding bullion by raising real borrowing costs relative to inflation expectations. Copper futures at USD 6.282/lb are modestly higher weekly (+0.93%) and monthly (+0.37%), reflecting industrial demand resilience despite broader macro uncertainty, while WTI oil’s mixed performance—up 3.82% this week but down significantly over the month (-18.58%)—dampens inflationary expectations that might otherwise spur safe-haven flows. Silver lags gold with a steeper weekly decline of -4.22%, highlighting divergent sentiment between precious and industrial metals in risk-off environments. The S&P 500 (SPX) gained +1.23% this week amid equity market strength, reducing the relative appeal of defensive assets like XAU/USD unless geopolitical tensions escalate further. Bitcoin trades at USD 63,987 with a weekly gain of +1.09%, showing digital asset resilience but offering no meaningful correlation benefit for gold investors seeking stability; its outperformance does not translate into reduced demand for traditional hedges during volatility spikes like those seen in the VIX’s recent -24.36% monthly drop. The low fear gauge reading now suggests a potential shift toward risk appetite, which could weigh on gold unless central bank tightening resumes or geopolitical risks surge again.
Upcoming Catalysts
- US Consumer Price Index — 2026-07-14: Inflation data will directly influence Federal Reserve rate expectations and real yields, which are key drivers for gold prices today.
- US Producer Price Index — 2026-07-15: Wholesale price trends provide early signals of inflation persistence that could alter the Fed's policy trajectory over the coming weeks.
- US Gross Domestic Product — 2026-07-30: The GDP print will reveal whether economic resilience supports a softer rate path or warrants hawkish sentiment, impacting XAU/USD momentum.
- US Non-Farm Payrolls — 2026-08-07: Labor market strength is critical for assessing Fed policy durability and the broader outlook for real interest rates affecting spot gold price dynamics.
Trading Idea
Given the strong downtrend and price trading below key moving averages, traders should consider a short position with an entry zone between USD 4,095 and USD 4,135. Place a stop loss above USD 4,210 to protect against a potential rejection from the SMA 20 resistance level near $4,186. The primary target is set at USD 3,970, which aligns with support structure below the recent consolidation zone and offers measured downside risk-reward. Investors can execute this strategy using COMEX gold futures or by shorting SPDR Gold Shares (GLD) and iShares Gold Trust (IAU), though physical gold from US dealers remains a long-only alternative for those avoiding leverage.
Price Outlook and FAQ
Gold is expected to trade within a range of USD 3,970–4,260 tomorrow as it consolidates near support ahead of upcoming data releases; for this week, the bias remains downward with key resistance at the SMA 50.
Is gold currently an effective inflation hedge for US investors? With annual CPI running at 4.27% while the 10Y Real Rate (TIPS) sits at 2.31%, real yields remain elevated and increase the opportunity cost of holding non-yielding assets like bullion, which limits its effectiveness as a pure inflation hedge right now.
How do Federal Reserve decisions and real interest rates impact gold prices? Gold reacts inversely to real rates because higher TIPS yields make cash bonds more attractive than physical metal; consequently, any Fed move that suggests slowing rate cuts or rising nominal yields while inflation stays sticky will typically exert downward pressure on the spot price.
What are the primary ways for US investors to acquire gold today? US-based traders can gain exposure through listed exchange-traded funds like SPDR Gold Shares (GLD) and iShares Gold Trust (IAU), or by purchasing physical coins directly from authorized dealers such as APMEX, JM Bullion, and The US Mint.
This article is for informational purposes only and does not constitute investment advice or a financial recommendation. Investing in financial assets involves risk.
Key Takeaways for Traders
- Current Market Stance: The gold price today trades below all major moving averages with a negative MACD line despite speculative net long positioning, confirming a bearish bias that requires traders to wait for confirmation before entering short positions near support levels.
- Key Technical Level to Watch: Price action must clear the $4142.8 SMA 20 and hold above it as immediate resistance while testing the critical support at $3962.5, which acts as a pivot point given its proximity below current prices.
- Primary Macro Driver: Monitor real interest rates driven by TIPS yields of 2.31% alongside CPI data scheduled for July 14, as rising real rates increase the opportunity cost of holding non-yielding gold and exert downward pressure on XAU/USD.
- Crucial Flow Signal: Note significant ETF outflows totaling approximately $1.97 billion in recent flows which contradict COT bullish positioning, indicating that institutional investors are selling shares despite futures speculators maintaining long positions for hedging purposes.
- Main Risk Consideration: Geopolitical volatility and potential oil price spikes could trigger temporary safe-haven inflows regardless of technical trends, but traders should maintain strict stop-losses above the $4180 entry zone to avoid being caught in a sharp reversal if demand softens further.

