Market Bias
Bearish-to-Neutral as XAU/USD trades below its 50- and 200-day moving averages while RSI hovers at neutral levels, reflecting persistent selling pressure despite recent weekly gains. The price action remains constrained by overhead resistance from the 60-day high near $4765.
Executive Summary
The gold price today USA is trading at $4,107 per ounce, reflecting a strong downtrend despite a weekly gain of 0.97%. While speculative positioning in futures remains bullish according to COT data, massive ETF outflows totaling nearly $9.2 billion this month are creating significant selling pressure that weighs on the gold price today USA. The metal has retreated from its multi-year highs as rising real rates and a resilient dollar erode demand for this non-yielding asset within the broader US gold market context. Investors must balance these opposing forces—strong technical support near recent lows versus persistent institutional distribution—as they assess whether current levels offer value or if further downside risks linger in the US gold market.
US Outlook: Fed Policy, Real Rates, and Gold's Safe-Haven Premium
- Fed policy trajectory: The Federal Reserve holds its funds rate steady at 3.63%, aligning with market expectations for a pause as the central bank weighs persistent inflation against slowing growth. This stance prevents further hikes but keeps borrowing costs elevated relative to historical norms.
- Real rates and gold: Real interest rates, measured by the 10Y TIPS yield of 2.41%, have remained stable this week. Since real yields represent the opportunity cost for holding non-yielding assets like XAU/USD, a steady or rising level creates headwinds that suppress price rallies unless offset by other factors.
- Dollar impact: The US Dollar Index (DXY) has weakened slightly over the past month to 99.8. A weaker dollar lowers gold's effective cost for international buyers and provides some technical support, though it does not fully negate the drag from higher real yields.
- Federal Reserve forward guidance: Recent communications suggest a data-dependent approach that leaves room for cuts if inflation continues to moderate toward the dual mandate target without sparking a recession. This cautious optimism supports gold over the next 1-3 months as markets price in potential easing cycles.
Technical Analysis
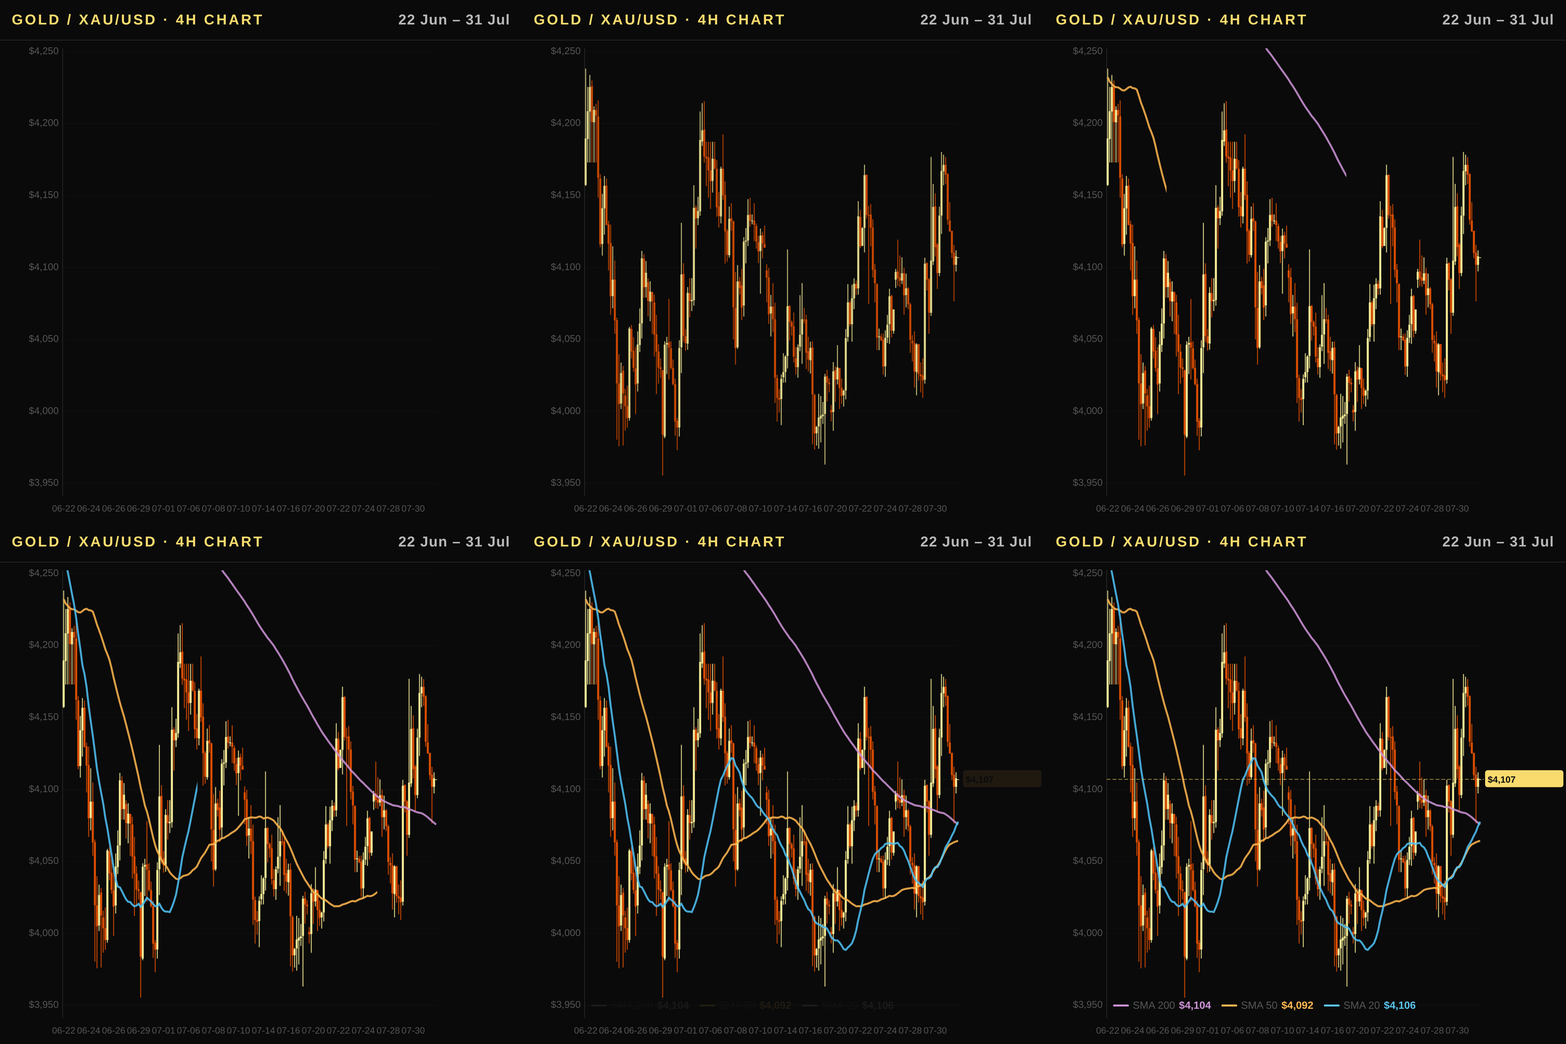
Gold is currently trading at $4107.0, holding just above the SMA 20 of $4070.1 but facing overhead resistance from the SMA 50 at $4187.9 and the SMA 200 near $4483.7. The price action reflects a strong downtrend structure, as spot XAU/USD remains well below its 52-week high of $5586.2 while testing support around the recent lows.
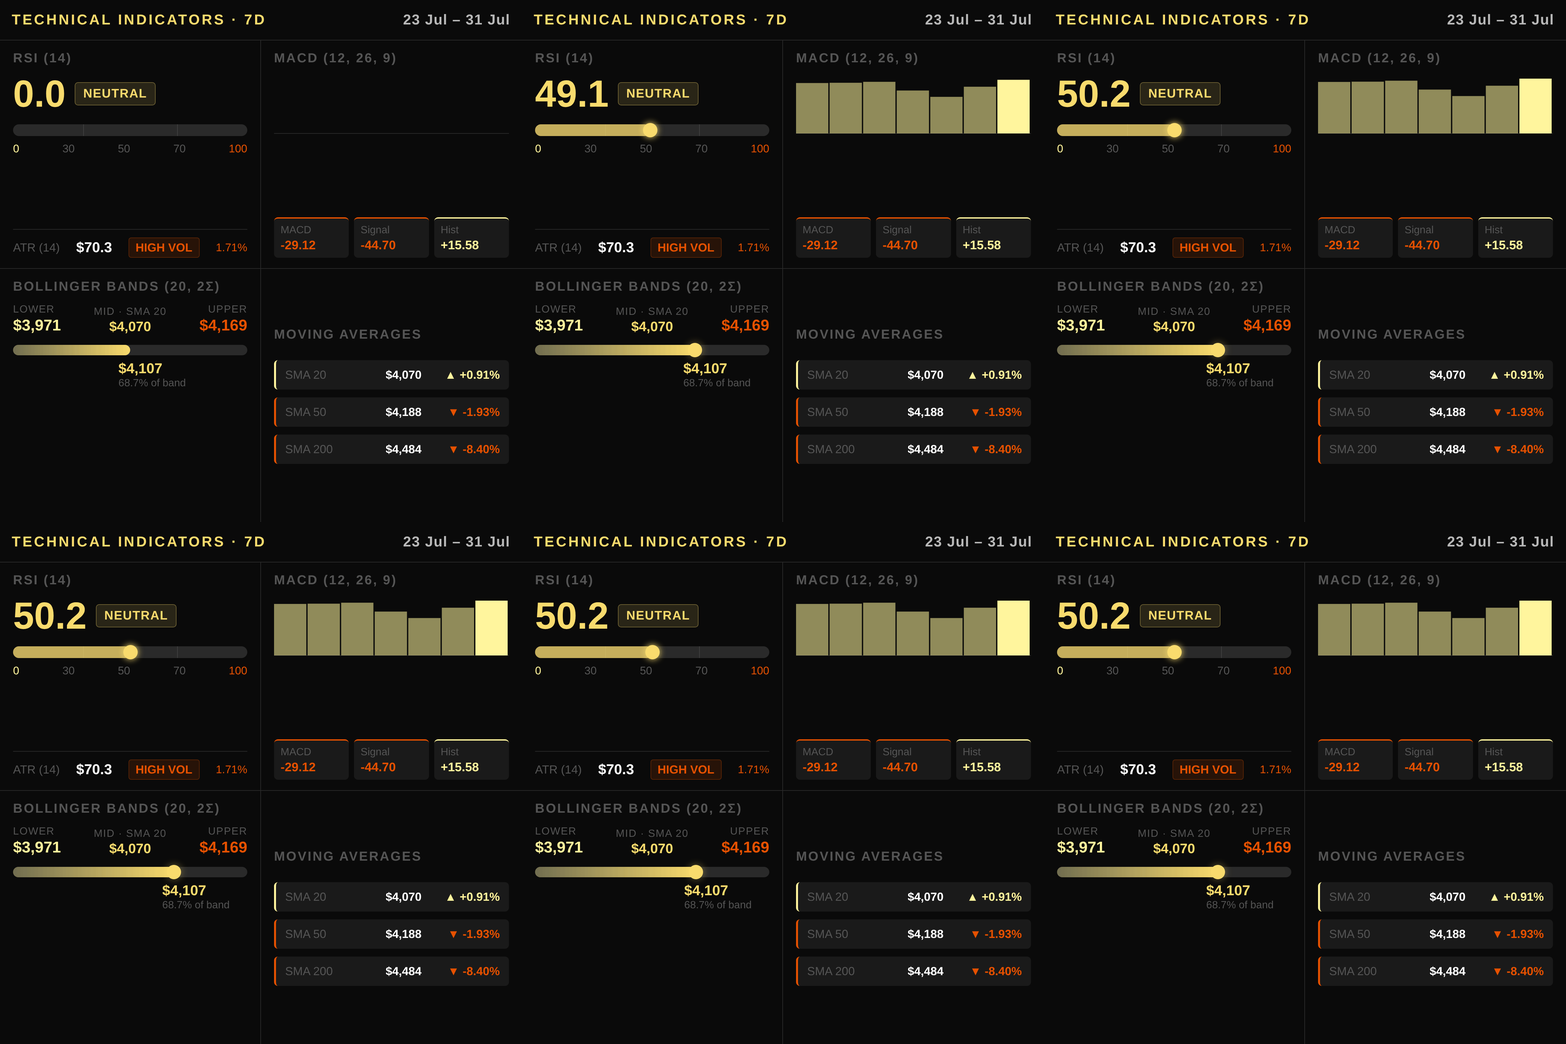
The Relative Strength Index (RSI) sits at 50.2, indicating neutral momentum that is marginally above the bearish threshold but lacks bullish conviction to sustain a reversal immediately. The MACD line shows -29.12 versus a signal of -44.69, with a positive histogram value of 15.58, signaling easing downside pressure within an established downtrend rather than a confirmed trend change.
Bollinger Bands frame the immediate volatility range between $3971.1 (lower band) and $4169.0 (upper band), while the Average True Range (ATR) of 70.3 suggests moderate price swings typical for this correction phase. Traders should watch key resistance at the 60-day high near $4765.2, which acts as a major ceiling, with immediate resistance overhead at the SMA 50 of $4187.9 and support below current levels at the SMA 20 of $4070.1 if selling pressure intensifies.
Macroeconomic Factors
The Federal Reserve maintains a policy rate of 3.63%, while the 10-year Treasury yield sits at 4.745% and the real rate, measured by TIPS, is 2.41%. Since gold pays no interest, rising real rates increase the opportunity cost for holding this non-yielding asset, creating a persistent headwind despite recent dips in bond yields. A weaker US Dollar Index (DXY) at 99.8, down 1.65% on the week, cushions international demand because it lowers the effective price of gold for foreign buyers, while geopolitical tensions add a temporary safe-haven premium to offset these fundamentals.
Geopolitical instability continues to drive risk-off flows into precious metals, though this support is often outweighed by strong US economic data showing 2.2% GDP growth and annual CPI inflation at 3.73%. The yield curve remains normal with the 10-year-2-year spread positive at 0.47%, indicating no immediate recession signal from bond markets that would typically spark a gold rally. Copper futures are trading higher on supply concerns, while silver faces pressure after falling 1.48% on the week due to its industrial sensitivity and lower liquidity compared to gold.
The US Non-Farm Payrolls report scheduled for August 7 will provide critical insight into labor market resilience, which influences Fed rate cut expectations later in the year. If inflation remains sticky near the current 3.73% annual pace, central bank policy may stay restrictive longer than markets anticipate, keeping real yields elevated and capping gold upside potential until a clear easing cycle begins.
Positioning and Market Flows
CFTC Commitment of Traders data reveals a bullish speculative bias among non-commercial traders, with net long positioning at 182,070 contracts. However, this week-over-week decline of -11,949 contracts indicates that aggressive bulls are pausing to absorb selling pressure before committing further capital.
Institutional flows remain the primary drag on sentiment as gold ETFs recorded a massive outflow valued at approximately $-9.2 billion for June. These significant withdrawals represent direct selling by large holders rather than rotation into physical metal, creating immediate downward price pressure that outweighs long-term demand narratives.
Central bank purchases continue to provide a structural floor beneath the asset class. While commercial hedgers maintain deep short positions of -212,309 contracts reflecting production-based risk management, this hedge activity does not contradict the ETF selling narrative but rather highlights divergent institutional behaviors in futures versus physical markets today.
Correlated Assets
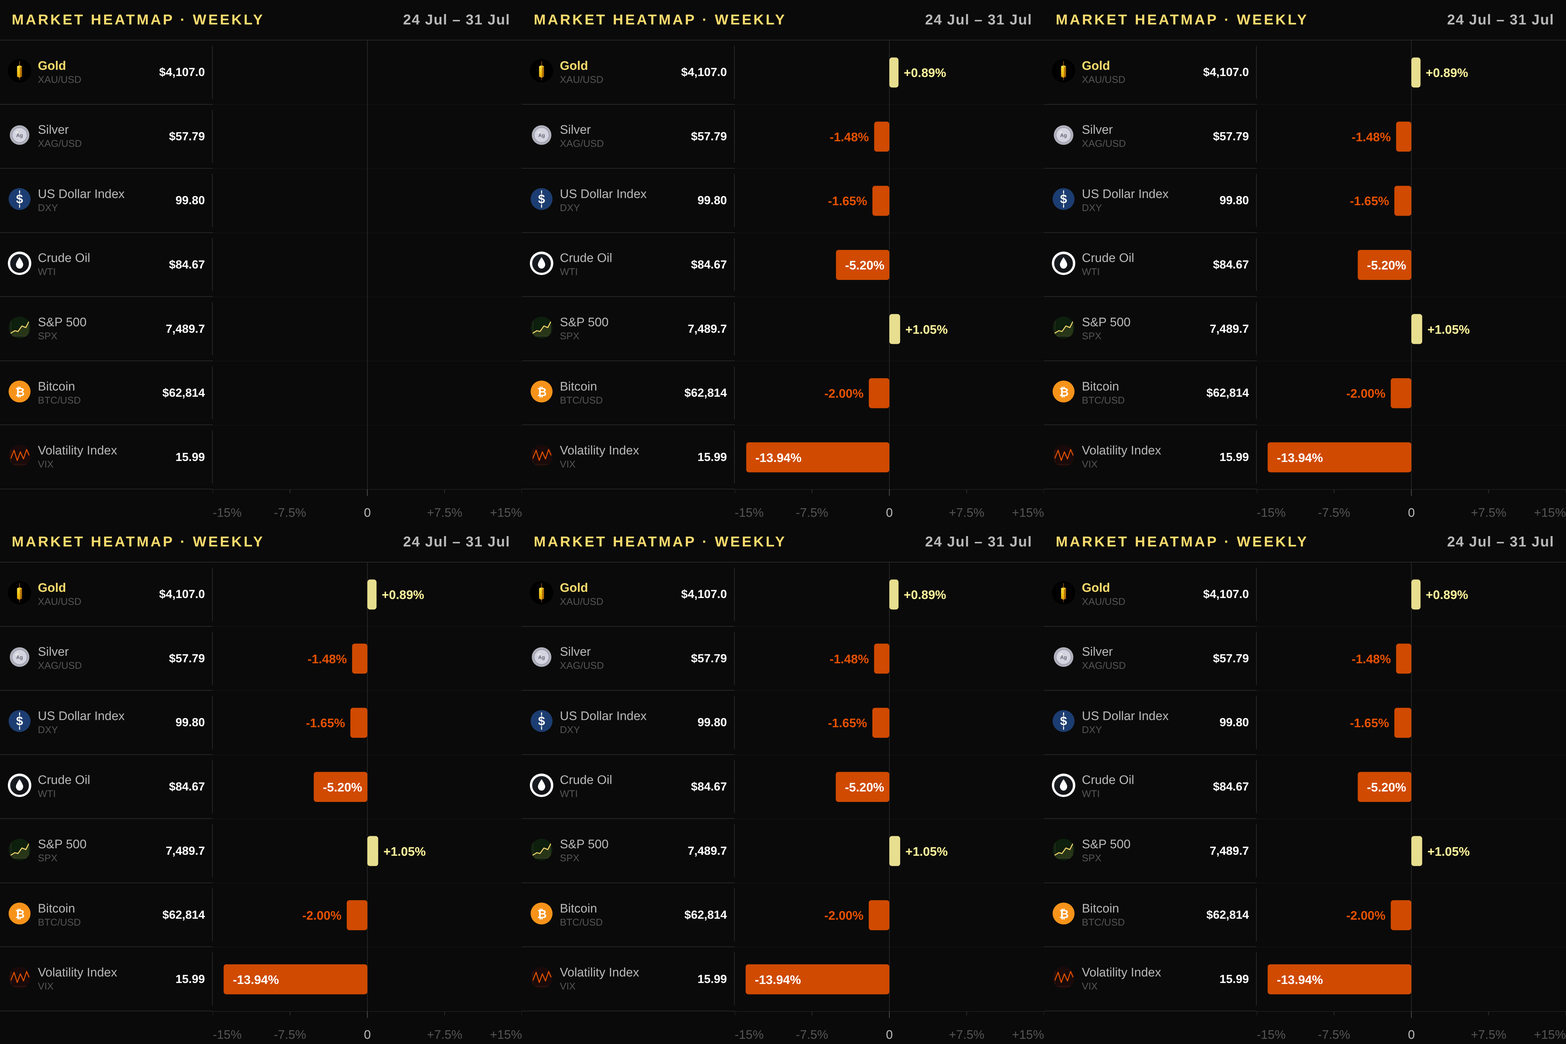
Gold's inverse relationship with the US Dollar Index (DXY) is currently intact, as the dollar has declined by 1.65% over the last week and 1.57% this month; a weaker DXY supports global demand for gold priced in USD while lowering its cost for foreign buyers. The yield curve remains normal with a positive 0.47% spread between the US10Y Treasury at 4.745% and the 2-year note at 4.11%, implying no imminent recession signal; however, the TIPS-based real rate of 2.41% still acts as a headwind by increasing gold's opportunity cost relative to bonds. US stock market sentiment is cautiously optimistic with the S&P 500 (SPX) rising 1.05% this week despite mixed monthly performance, suggesting risk appetite remains intact but volatile enough that safe-haven flows can interrupt equity rallies without causing a crash. Copper futures have strengthened significantly over both weeks (+2.3%) and months (+5.74%), indicating robust industrial demand for infrastructure projects which supports the broader economic backdrop while offering no direct hedge against gold's price action in this environment. Silver has weakened by 1.48% on the week and 4.71% monthly, reflecting a divergence from gold where investors may prefer bullion over silver during periods of uncertainty or when industrial demand slows relative to precious metal sentiment. Crude oil prices (WTI) show mixed signals with a weekly decline of -5.2% but a strong monthly gain of +23.26%, highlighting how geopolitical tensions can drive long-term energy costs upward even as short-term supply gluts temporarily suppress spot prices; rising WTI generally supports gold's inflation hedge narrative while falling prices might dampen it in the near term if recession fears spike. The VIX fear gauge has dropped 13.94% weekly and 3.62% monthly, indicating reduced market volatility which typically reduces safe-haven demand unless new geopolitical risks emerge to counteract this calm; gold's recent uptick coincided with a slight drop in the DXY rather than extreme fear spikes like those seen during banking crises or regional wars. Bitcoin has fallen 1.25% weekly and 1.08% monthly alongside other risk assets, reinforcing that digital tokens currently lack independent safe-haven status compared to gold; while some headlines frame bitcoin as an oasis of calm relative to war-torn markets, the data shows it moving in tandem with equities rather than acting as a true store of value during instability. This correlation structure confirms that gold is driven primarily by real rates and dollar strength here, not just macroeconomic fear or digital asset dynamics.
Upcoming Catalysts
- US Non-Farm Payrolls — 2026-08-07: Strong employment data could anchor real rates higher, weighing on gold prices ahead of September decisions.
- US Consumer Price Index — 2026-08-12: An upside surprise in inflation would reinforce hawkish Fed sentiment and increase the opportunity cost for holding this non-yielding asset.
- US Producer Price Index — 2026-08-13: Rising input costs may signal persistent domestic demand pressure, potentially delaying further interest rate cuts that typically boost bullion prices.
- US Gross Domestic Product — 2026-08-26: A revised growth print showing economic resilience could reduce near-term recession fears and limit safe-haven flows into gold.
Trading Idea
Given gold's current price at USD 4107.0 and its trade below the SMA50 of USD 4187.9, we recommend a short position with an entry zone between USD 4120 and USD 4160 as price tests overhead resistance. Place your stop loss above USD 4190 to protect against a potential bounce off the mid-Bollinger Band support at USD 4070. The primary target is set at USD 3950, which offers favorable risk-reward by capturing downside momentum toward the 60-day low support level of USD 3962. US investors can execute this view using SPDR Gold Shares (GLD), iShares Gold Trust (IAU), or physical gold from reputable dealers like APMEX and JM Bullion.
Price Outlook and FAQ
Gold is expected to trade within a range of USD 3,985–USD 4,230 tomorrow, bracketing today’s current price of USD 4,107 while reacting to short-term volatility consistent with an ATR of USD 70.3. The one-week directional bias remains bearish-to-neutral as prices navigate overhead resistance near $4187.9 and struggle against rising real rates that weigh on non-yielding assets like XAU/USD in the US gold market.
Is gold still a reliable inflation hedge for US investors given current economic data? Gold’s performance depends heavily on the interplay between headline CPI figures, which currently run at 3.73%, and real interest rates measured by TIPS yields of 2.41%. While high nominal inflation typically supports bullion prices, the opportunity cost created by a positive spread between Treasury yields and inflation can dampen gold’s appeal if central banks maintain restrictive policy stances for an extended period.
How do Federal Reserve rate decisions and real rates impact the price trajectory of US dollar-denominated gold? The inverse relationship between real interest rates and gold prices is fundamental to valuation; when 10Y Real Rate (TIPS) rises, holding non-yielding gold becomes less attractive compared to income-generating assets like bonds. Consequently, any hawkish Fed commentary that pushes the funds rate higher without a corresponding jump in inflation will tighten this spread further, exerting downward pressure on spot XAU/USD prices.
What are the primary vehicles for US investors seeking exposure to physical or paper gold? US investors can gain immediate access via exchange-traded products such as SPDR Gold Shares (GLD) and iShares Gold Trust (IAU), both listed on major NYSE exchanges, which offer high liquidity with low commission fees. For those preferring tangible assets, reputable US dealers like APMEX, JM Bullion, or the official United States Mint provide secure options for purchasing bullion coins and bars directly from domestic sources.
This article is for informational purposes only and does not constitute investment advice or a financial recommendation. Investing in financial assets involves risk.
Key Takeaways for Traders
- Market Stance: The gold market remains under a bearish stance as price action continues below key moving averages and technical resistance sits at $4765.2, requiring traders to wait for confirmation of trend reversal before initiating new long positions.
- Key Technical Level: Traders should focus on the 60-day low support near USD 3962.5 this week as a potential floor that could define short-term volatility and signal whether sellers are losing momentum in the US gold market.
- Macro Driver: Monitor the Fed Funds Rate at 3.63% alongside real rates derived from TIPS yields, which currently sit at 2.41%, to gauge how rising opportunity costs continue to suppress demand for non-yielding assets like XAU/USD.
- Flow Signal: Pay close attention to the ongoing ETF outflow trend of approximately $9.19 billion in monthly terms and the decline in speculative net contracts, which both indicate institutional caution and a lack of aggressive buying pressure from large players.
- Risk Consideration: Investors must hedge against geopolitical shocks or sudden dollar weakness that could invalidate the current downtrend by triggering safe-haven flows, as these events often override technical selling logic regardless of real rate levels.
