Market Bias
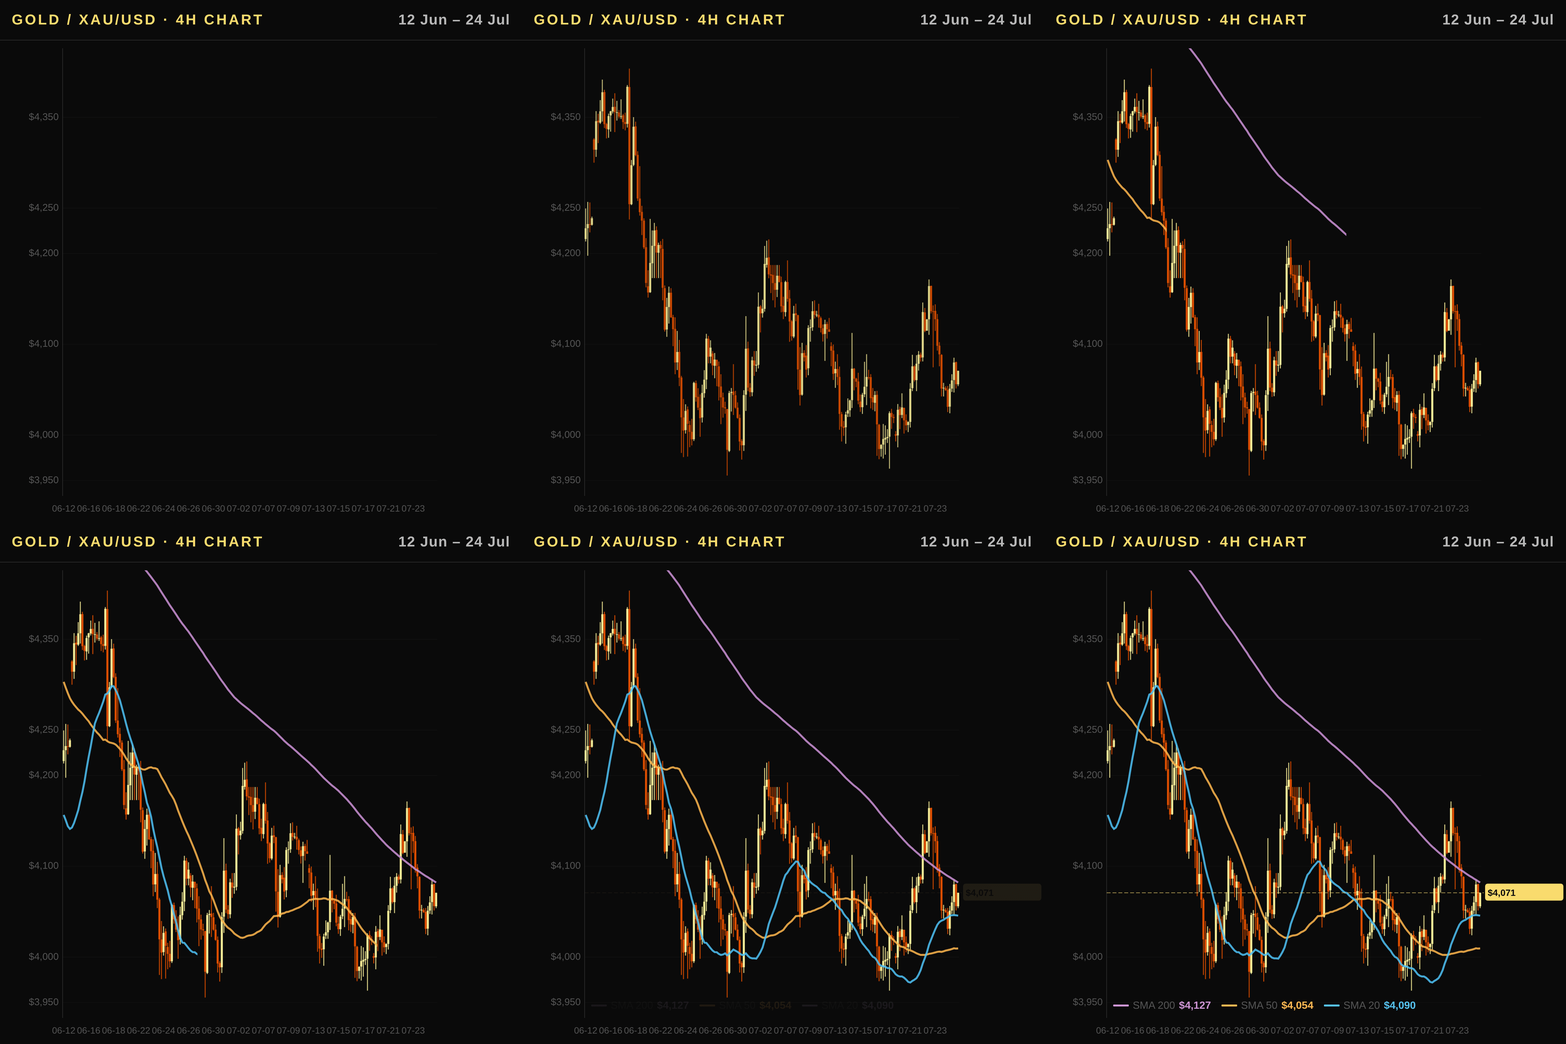
Bearish. Gold prices are trading below all key moving averages, with current levels at $4067.6 sitting beneath the SMA 20 ($4073.1), SMA 50 ($4233.9), and SMA 200 ($4486.4). The RSI sits near neutral territory at 46.2, indicating a lack of strong bullish momentum while remaining above oversold conditions. Rising real rates have increased the opportunity cost for holding this non-yielding asset, adding to technical weakness. Although speculative positioning shows some net long accumulation and geopolitical risks persist as safe-haven drivers, these factors are insufficient to overcome the dominant downtrend structure confirmed by price action below the major averages.
Executive Summary
The gold price today in the US (USD) stands at $4,067.6/oz amid a pronounced technical downtrend driven by rising real rates and persistent ETF outflows. Despite a modest 1-week gain of 1.37%, structural selling pressure remains evident as institutional investors withdrew approximately $9.2 billion in June via SPDR Gold Shares (GLD) and iShares Gold Trust (IAU). The Federal Reserve’s steady stance, with the Fed Funds Rate at 3.63% and real yields on TIPS rising to 2.43%, continues to elevate gold’s opportunity cost for US holders. While geopolitical tensions provide a fleeting safe-haven premium, momentum indicators like RSI (14) at 46.2 suggest oversold conditions rather than immediate reversal potential in the short term.
US Outlook: Fed Policy, Real Rates, and Gold's Safe-Haven Premium
- Fed policy trajectory: The Federal Reserve maintains a funds rate of 3.63%, with markets closely watching for potential adjustments as inflation remains sticky at 3.73%. This steady stance influences the path of real rates, which currently sit higher than in previous cycles, increasing the opportunity cost for holding non-yielding gold and weighing on the US gold market sentiment.
- Real rates and gold: The 10Y Real Rate (TIPS) is rising at a pace that suppresses bullish momentum, as investors rotate into yield-bearing assets like Treasury bonds rather than price fluctuations in XAU/USD. While nominal yields have dipped slightly to 4.47%, the real rate of 2.43% remains an elevated drag on gold prices, limiting upside potential absent a sharp economic slowdown or risk-off event.
- Dollar impact: The US Dollar Index (DXY) is holding steady near 101.43 with minimal weekly fluctuation, keeping the effective cost for foreign buyers stable but preventing significant relief for bulls in this edition of gold price today USA analysis. A stronger dollar continues to cap global demand growth, reinforcing a cautious tone despite recent weekly gains.
- Federal Reserve forward guidance: Recent commentary suggests the Fed is data-dependent and unlikely to cut rates aggressively until inflation shows sustained progress toward its 2% target. This dovish shift in rhetoric would be required to lower real yields further; currently, hawkish bias persists enough to keep gold under pressure for the near term.
Technical Analysis
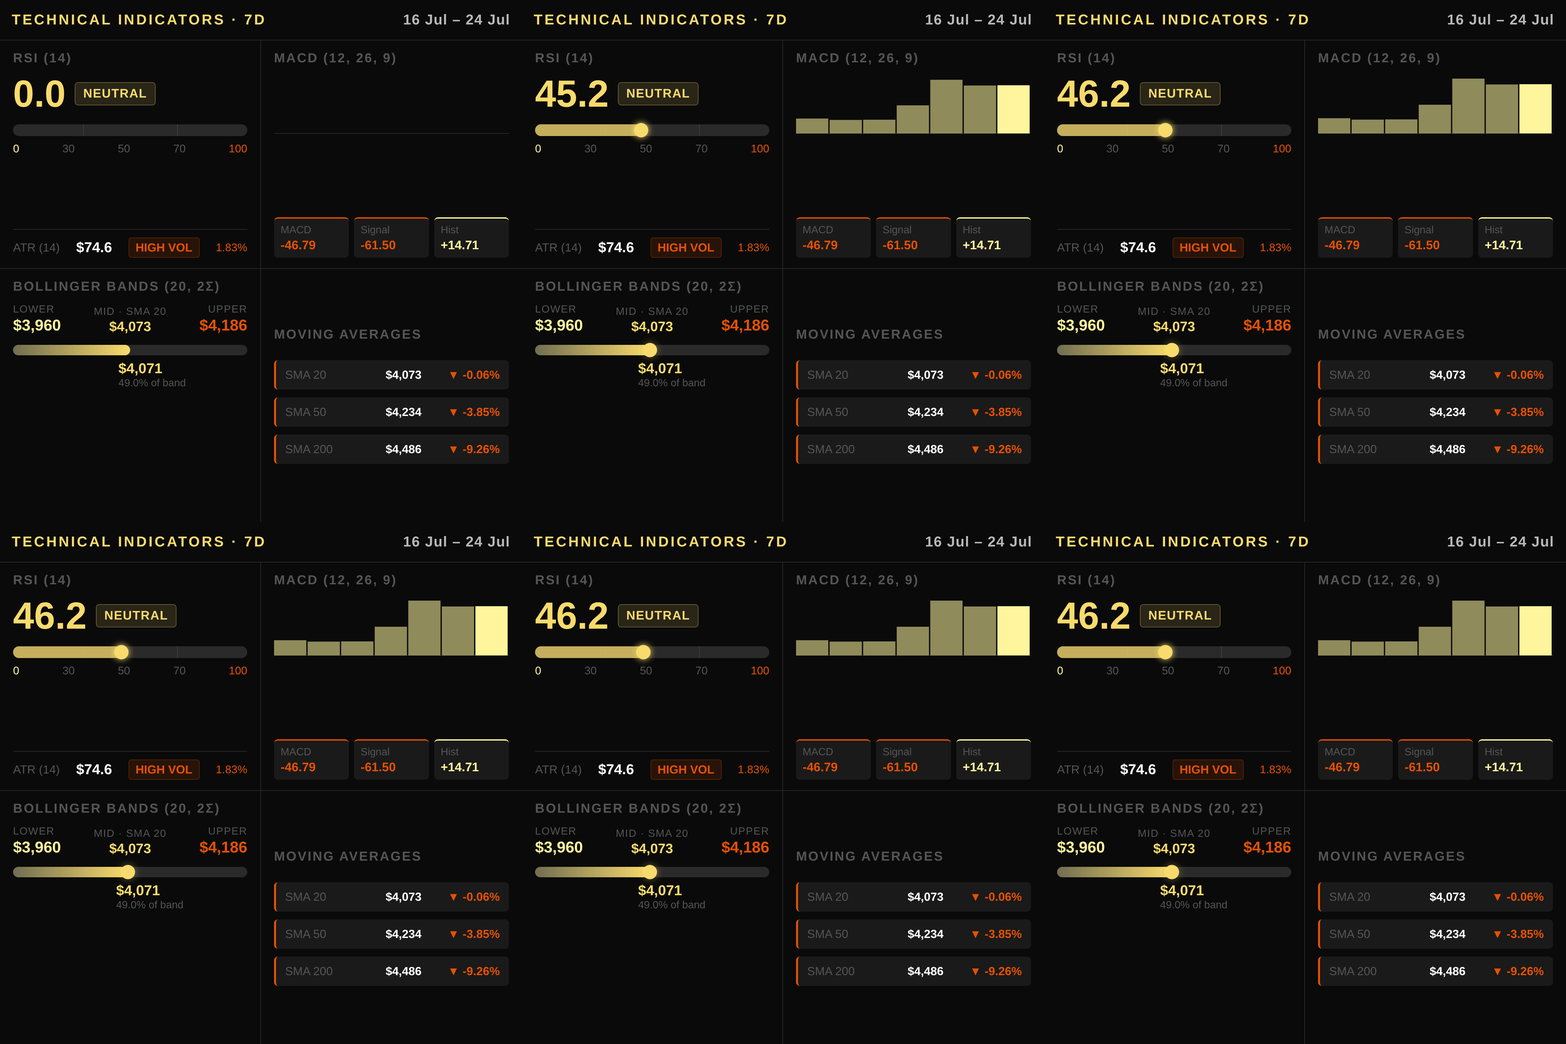
Gold is currently trading at $4067.6 in a confirmed strong downtrend, having fallen below key moving averages that act as overhead resistance. The price sits just under the 20-day simple moving average (SMA) of $4073.1, while remaining significantly distant from the 50-day SMA at $4233.9 and the yearly benchmark 200-day SMA near $4486.4. This configuration indicates that buyers have failed to defend recent lows, leaving a heavy ceiling of moving average resistance above current levels. Momentum remains weak with the Relative Strength Index (RSI) at 46.2, sitting just below the neutral level of 50 and signaling lack of bullish conviction without yet reaching oversold territory for a bounce. The MACD line reads -46.79 against a signal line of -61.5, creating a positive histogram of +14.71 that suggests short-term downside momentum is easing but the primary trend remains bearish until a crossover occurs. Volatility, measured by an Average True Range (ATR) of 74.6, implies daily swings could easily exceed $30 to $40 per ounce. Bollinger Bands frame this action with an upper band at $4186.4 and a lower band near $3959.8; price is currently hovering in the middle third of this range, suggesting no immediate breakout or breakdown from these statistical limits. Immediate support lies at the 60-day low of $3962.5, while resistance targets include the SMA 20 and the significant psychological barrier near $4186.
Macroeconomic Factors
The Federal Reserve has maintained its policy rate at 3.63%, yet real interest rates have risen to a ten-year TIPS yield of 2.43% over the past month, creating an increasingly unfavorable environment for non-yielding gold in the US market. This uptick in real yields raises the opportunity cost of holding bullion, acting as a persistent headwind that suppresses demand even when geopolitical tensions flare globally. Meanwhile, the ten-year Treasury yield has climbed to 4.703%, while short-term rates remain near lows, indicating an upward-sloping but tightening curve that continues to weigh on gold prices in USD terms. The US Dollar Index (DXY) remains resilient at 101.43 with a weekly gain of 0.69%, reinforcing the inverse relationship observed across the US gold market: as the dollar strengthens, it makes XAU/USD more expensive for international buyers outside North America, dampening global demand despite occasional domestic safe-haven flows. Geopolitical volatility continues to provide intermittent support through risk-off sentiment, though this premium is often insufficient to overcome the drag from higher real yields and a stubbornly strong greenback.
Positioning and Market Flows
The CFTC Commitment of Traders report reveals a bullish speculative bias in gold futures, with non-commercial net longs expanding by 2,571 contracts to reach 183,910 positions over the past five weeks. This accumulation indicates growing institutional confidence despite recent price weakness and technical resistance near current levels. Commercial hedgers maintain their short stance of -213,199 contracts, reflecting standard producer risk management rather than a fundamental shift in gold's long-term outlook.
In contrast to futures positioning, ETF flows remain heavily bearish for the US market. SPDR Gold Shares (GLD) saw net outflows totaling $-9.19 billion last month as investors reduced physical exposure amid rising real rates and technical consolidation below key moving averages. This divergence highlights a temporary rotation away from paper gold allocations while futures traders anticipate a potential bounce near support zones.
Central bank demand continues to provide structural underpinnings for the broader bull market, though their impact is muted on short-term price action as they focus on strategic reserve accumulation rather than active trading flows.
Correlated Assets
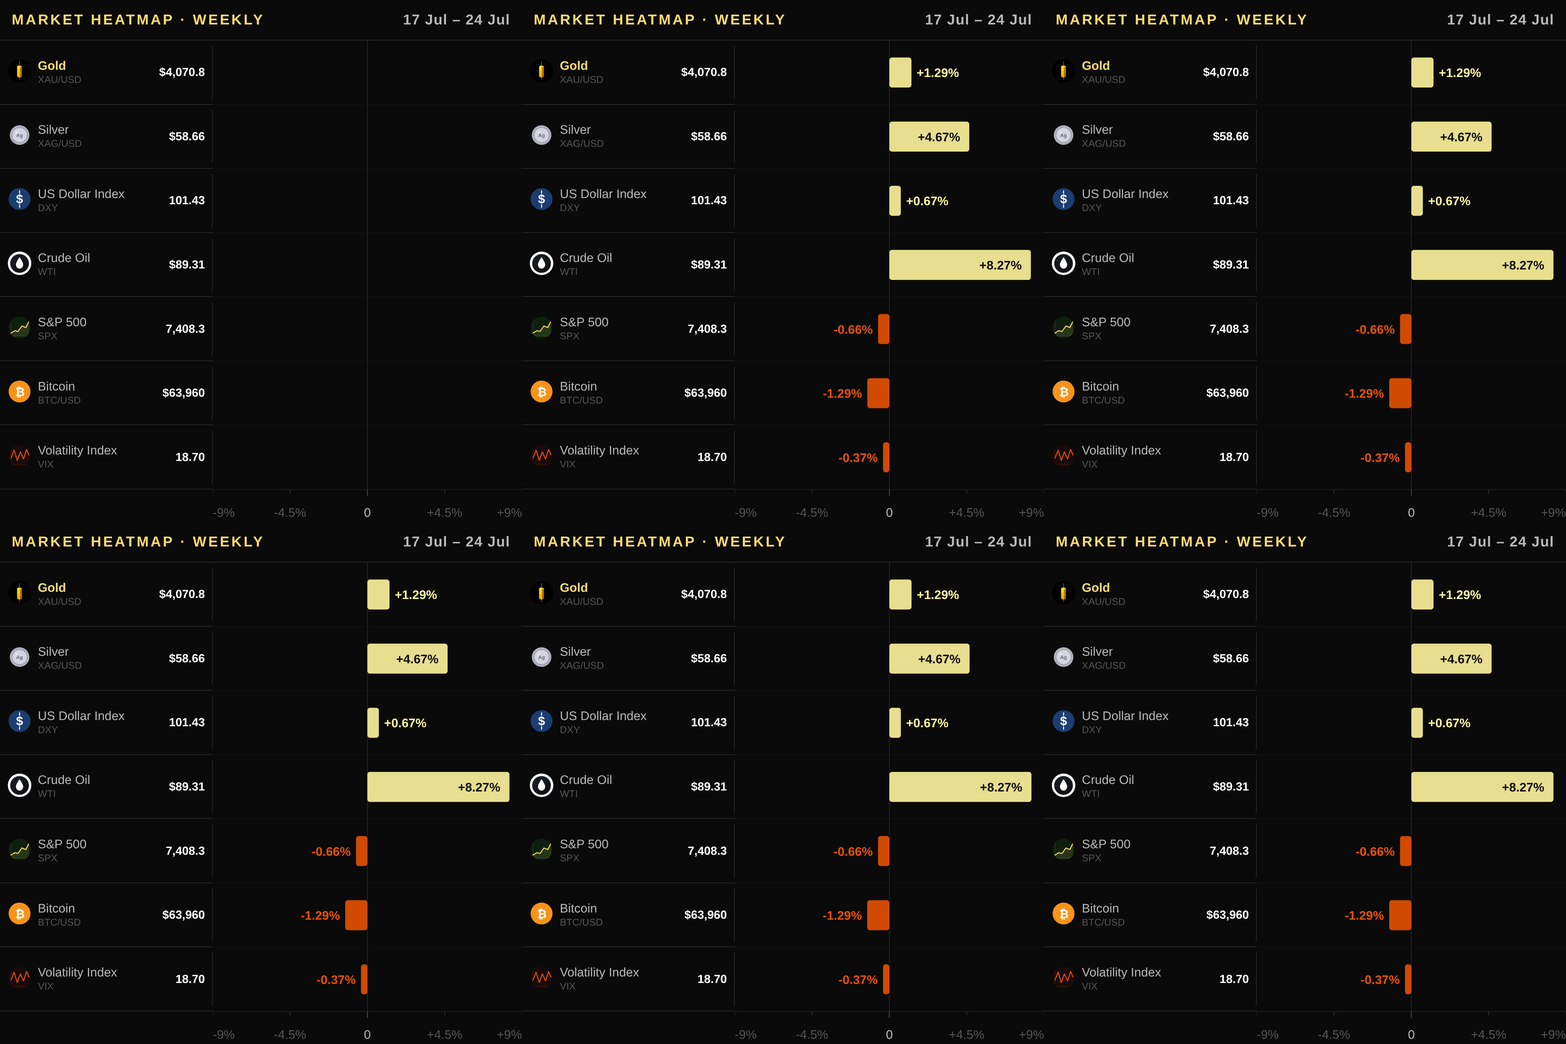
Gold's price action is heavily influenced by a basket of correlated assets, including the US Dollar Index (DXY), sovereign yields, industrial metals, and equities. The DXY sits at 101.43, showing an uptick of 0.69% for the week while remaining largely flat month-over-month; this modest dollar strength creates headwinds that make gold more expensive in non-US currencies, potentially dampening global demand despite safe-haven flows from geopolitical instability. Simultaneously, US Treasury yields are rising sharply: the 10Y nominal yield at 4.703% has climbed significantly over both weeks and months, pushing real rates (TIPS) higher and increasing the opportunity cost for holding non-yielding gold. Industrial demand indicators also show a divergence; copper is rallying with weekly gains of +4.11%, while silver remains volatile after gaining nearly 5% in price yet falling further on technical weakness this week at $58.66 per ounce, reflecting risk sentiment rather than pure industrial scarcity. Energy markets provide another layer: WTI oil has surged over 24% month-over-month to $89.31 a barrel, reinforcing inflationary expectations that complicate the Fed's rate-cutting path and support gold as an alternative store of value when equities falter. The S&P 500 (SPX) retreated 1.67% this week while the VIX fear gauge spiked to 18.7 with a sharp weekly jump, signaling market anxiety that can trigger safe-haven inflows into bullion even as higher rates loom. Bitcoin trades at $63,960 and fell slightly on the week but remains uncorrelated in the traditional sense; while digital assets occasionally outperform during crises, gold retains its unique status among central banks and institutions as a hedge against fiat debasement without relying solely on speculative momentum or regulatory arbitrage dynamics that characterize crypto markets.
Upcoming Catalysts
- US Gross Domestic Product — 2026-07-30: A key gauge of overall economic health that influences Federal Reserve policy expectations and real rates, directly impacting gold’s opportunity cost environment.
- US Non-Farm Payrolls — 2026-08-07: Labor market data often shapes inflation outlooks; strong employment can delay rate cuts while weak readings may accelerate them, altering the bullish or bearish case for XAU/USD.
- US Consumer Price Index — 2026-08-12: The primary measure of annual inflation will determine whether real rates rise or fall as prices evolve, which is critical given gold’s sensitivity to TIPS yields and Fed stance shifts.
- US Producer Price Index — 2026-08-13: Wholesale pricing trends offer early signals for consumer price pressures; persistent PPI strength could sustain inflation expectations even if CPI prints lower later in the month.
Trading Idea
Given the bearish market bias driven by price action below key moving averages and rising real yields, traders should consider a short position on XAU/USD with an entry zone between USD 4055 and USD 4120 near current resistance levels. A stop loss is placed at USD 4187 above the upper Bollinger Band to account for potential volatility spikes while protecting capital from unexpected risk-off flows. The target sits at USD 3960, aligning with the immediate support level where buyers have historically defended price action in this downtrend structure. US investors can implement this strategy by selling SPDR Gold Shares (GLD) or iShares Gold Trust (IAU) shares on major exchanges, trading COMEX gold futures for leverage, or holding physical bullion through reputable US dealers like APMEX and the US Mint.
Price Outlook and FAQ
Gold is expected to trade between $3,950 and $4,185 tomorrow as it attempts a bounce off immediate support while staying under the moving average cluster that defines this strong downtrend for the US gold market. The one-week directional bias remains cautiously bearish with key resistance near the SMA 20 at $4,073 acting as overhead pressure against any sustained rally above $4,186.
Is gold a good inflation hedge for US investors right now given current CPI and real TIPS rates? Gold currently offers limited protection from headline inflation because rising real interest rates are eroding its relative attractiveness. With the annual US CPI at 3.73% and the 10-year Treasury Inflation-Protected Securities yield climbing to 2.43%, holding a non-yielding asset like gold incurs an increasing opportunity cost for investors seeking to preserve purchasing power against consumer price increases.
How do Federal Reserve rate decisions and real rates affect gold prices in the US? The Fed's stance on interest rates directly dictates the opportunity cost of owning gold, as higher yields make bonds more attractive compared to this non-income-generating asset. A rise in the 10-year TIPS yield signals tightening financial conditions that typically weigh heavily on XAU/USD, whereas a cut or stable real rate environment would provide immediate tailwinds for prices within the US market.
How can investors buy gold through ETFs and physical dealers? US residents looking to gain exposure should consider buying shares of SPDR Gold Shares (GLD) or iShares Gold Trust (IAU) listed on major exchanges like the NYSE, which provide liquidity and low-cost access to spot prices. Alternatively, individuals may purchase physical bullion directly from reputable US mints such as the US Mint, or through specialized dealers including APMEX and JM Bullion for secure tangible assets.
This article is for informational purposes only and does not constitute investment advice or a financial recommendation. Investing in financial assets involves risk.
Key Takeaways for Traders
- Market Stance: The XAU/USD market remains bearish as price trades below all major moving averages, suggesting traders should focus on short entries near current levels rather than chasing rallies in a strong downtrend structure.
- Technical Level: Watch the 60-day low at $3962.5 and the SMA 20 line at $4073.1 closely; price holding below these zones confirms weakness, while any sustained break above $4080 could signal a temporary pause in selling pressure before the next lower high is tested.
- Macro Driver: Monitor real interest rates driven by the TIPS yield of 2.43% alongside Fed policy expectations, as rising real borrowing costs increase opportunity costs for non-yielding gold and suppress demand from US-based investors seeking higher bond returns.
- Flow Signal: Be cautious despite bullish COT futures positioning; large ETF outflows totaling approximately $9.19 billion in the prior month indicate institutional selling that contradicts speculative long positions, creating a divergence where physical supply pressure outweighs futures buying interest.
- Risk Consideration: Geopolitical volatility and sharp declines in oil prices remain key hedge factors for gold investors to consider, though these drivers may be secondary if real rates rise further or the US dollar strengthens beyond recent weekly gains.
