Market Bias
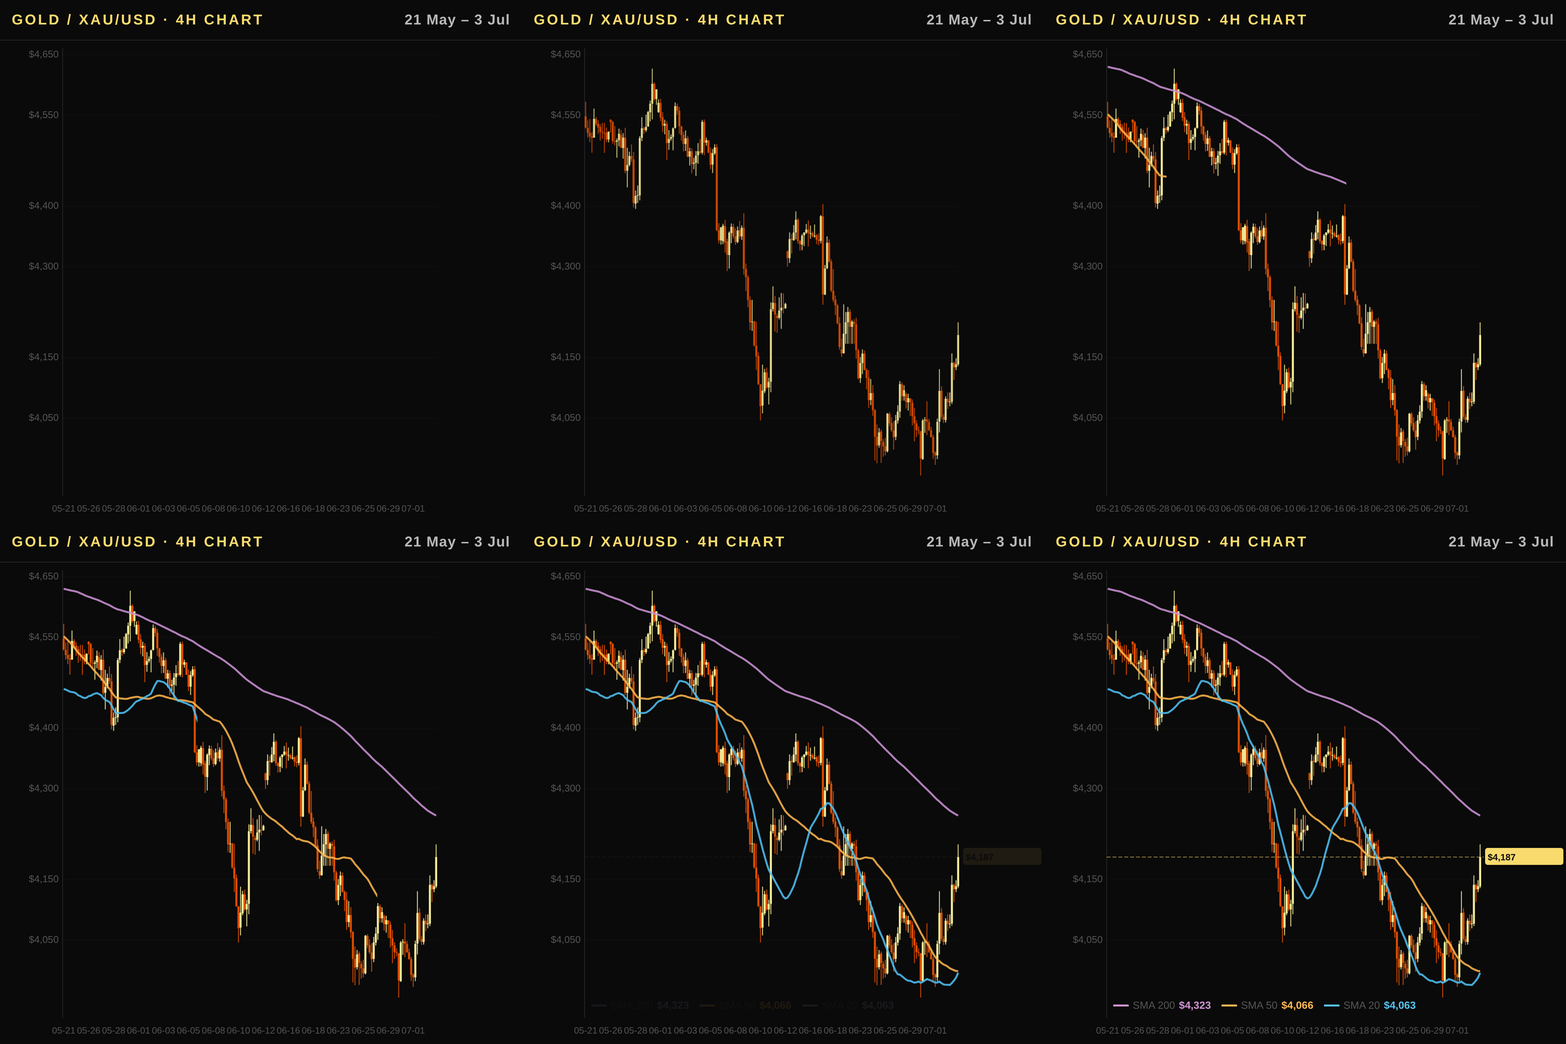
Bearish. Gold prices in USD are currently trading below the 50- and 200-day moving averages (while holding just above the SMA 20), with a technical RSI reading of 47.1 firmly below the neutral level of 50, indicating short-term weakness despite recent weekly gains. While speculative positioning remains bullish according to COT reports, substantial monthly ETF outflows totaling over $1.9 billion counteract this futures-based optimism and highlight significant institutional selling pressure within the US gold market. The prevailing downtrend structure suggests that downside momentum will likely persist until price action can decisively reclaim key overhead resistance levels near $4,879.
Executive Summary
The gold price today in the US (USD) is trading at $4,187.3, reflecting a resilient recovery despite persistent macroeconomic headwinds and significant recent ETF outflows of approximately $2 billion over May 2026. While speculative positioning remains net long according to COT data, suggesting bullish sentiment among large speculators, the monthly flow bias indicates that institutional investors are currently reducing exposure through gold ETFs. Rising US real rates on TIPS at 2.25% continue to increase the opportunity cost for holding this non-yielding asset, creating a fundamental bearish backdrop that contrasts with the recent weekly price gain of 2.66%. This analysis suggests that while geopolitical tensions and safe-haven demand may provide temporary support, the gold price today USA outlook hinges on whether real yields can stabilize or decline to alleviate selling pressure from domestic funds seeking higher Treasury returns.
US Outlook: Fed Policy, Real Rates, and Gold's Safe-Haven Premium
- The Federal Reserve maintains a Fed Funds Rate of 3.63%, creating an environment where real interest rates influence non-yielding assets like gold directly through opportunity cost dynamics in the US gold market.
- Current 10Y Treasury yields at 4.47% represent nominal returns, while the real rate measured by TIPS stands at 2.25%, indicating a slight increase that currently exerts bearish pressure on the gold price today USA valuation.
- Rising real rates (the 10Y TIPS yield is up about +0.05% month-over-month) elevate the opportunity cost for holding gold, acting as a headwind despite its status as a safe-haven asset during geopolitical tensions in the Middle East.
- The US Dollar Index (DXY) is trading at 100.86 with a weekly decline of -0.56%, which lowers the effective cost for foreign buyers and provides partial support to global demand even amid domestic rate sensitivity.
- Forward guidance from recent FOMC statements suggests rates will remain restrictive until inflation cools further, implying limited immediate cuts that sustain higher real yields unfavorable for bullion prices in the short term.
Technical Analysis
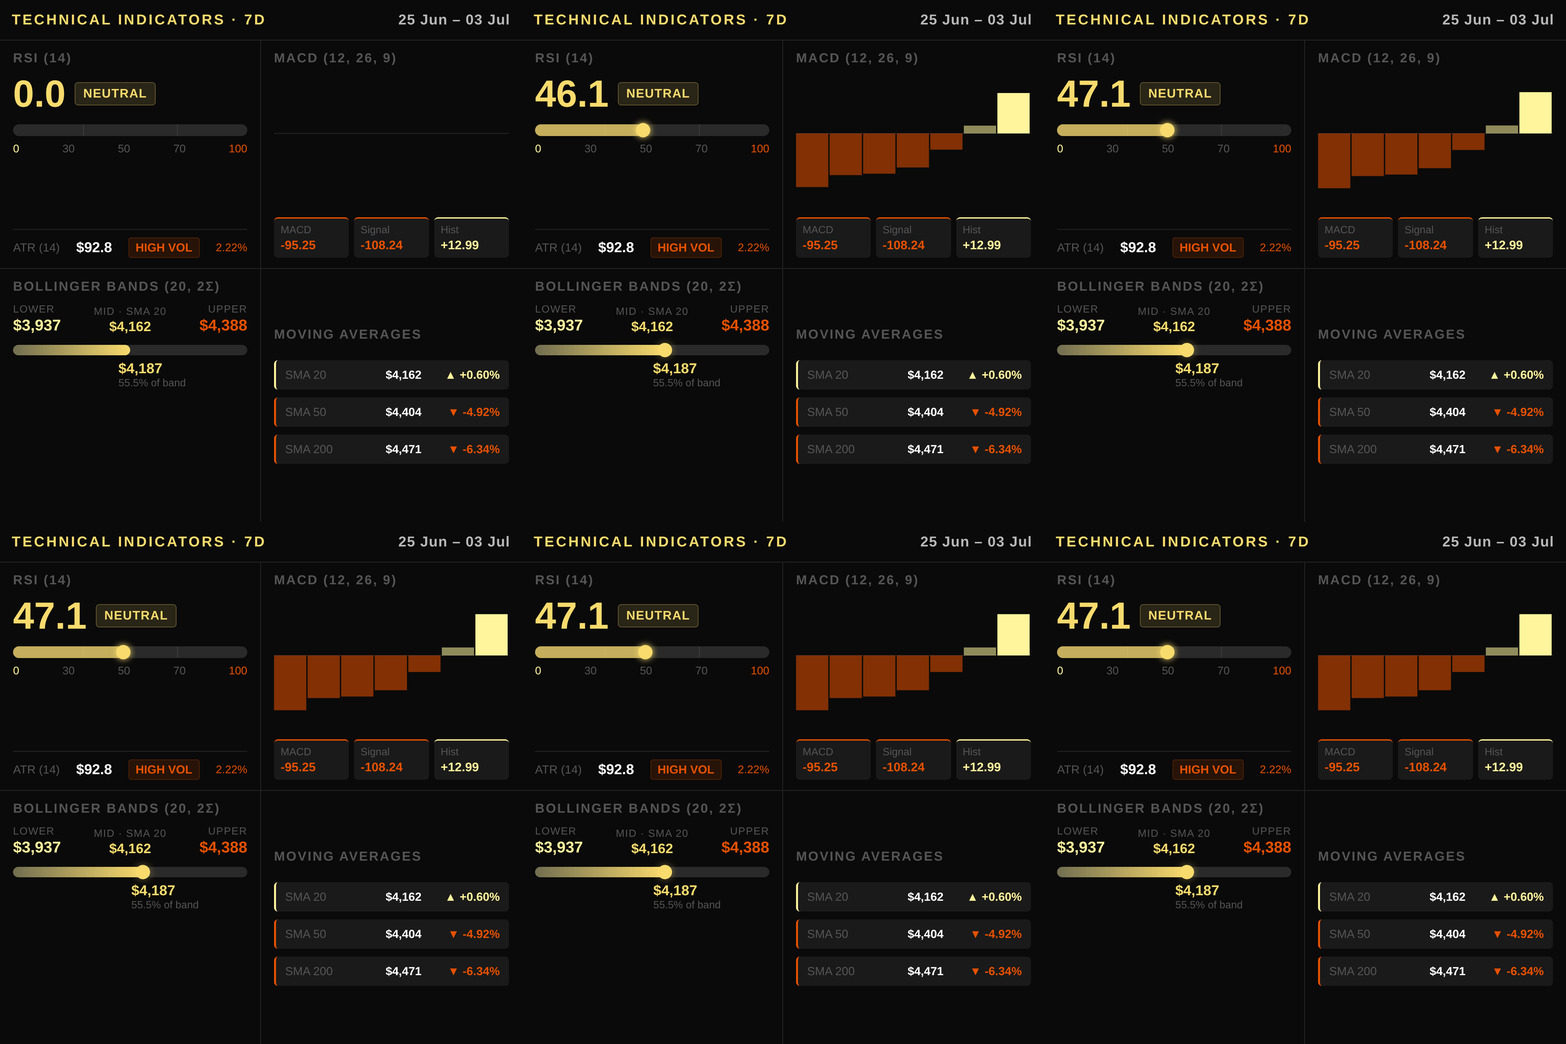
Gold is currently trading at $4187.3, hovering just above the SMA 20 of $4162.4 but well below both the SMA 50 ($4404.1) and SMA 200 ($4470.7), confirming a strong downtrend structure in the US gold market. The RSI sits at 47.1, indicating neutral-to-bearish momentum that has not yet reached oversold territory, while the MACD histogram of +12.99 suggests fading bearish pressure as the signal line remains below zero. Volatility is contained within Bollinger Bands ranging from $3936.5 (lower) to $4388.4 (upper), with price action oscillating near the middle band at $4162.4, signaling a lack of decisive breakout energy. Key support rests firmly at the 60-day low of $3962.5, which must hold to prevent further downside exposure toward the lower Bollinger Band level. Conversely, resistance is anchored by the recent 60-day high near $4879.7, a formidable ceiling that requires sustained volume and bullish catalysts to breach in the short term. Traders should watch for price action below $3962.5 as confirmation of deeper corrections or above $4250 as a potential first step toward reclaiming the 50-day moving average, though the path forward remains obstructed by higher SMAs overhead until real rate dynamics shift favorably.
Macroeconomic Factors
The Federal Reserve's policy stance remains a primary driver for XAU/USD, with current funds rates at 3.63% setting the baseline for borrowing costs. While headline inflation sits at 4.27%, real interest rates—measured by the TIPS yield of 2.25%—are rising slightly, up about +0.05% month-over-month, increasing the opportunity cost of holding non-yielding gold and exerting downward pressure on prices. This divergence between nominal yields, which hover near 4.47%, and real rates creates a challenging environment where capital prefers yield-bearing assets over bullion unless geopolitical risks escalate significantly.
The US Dollar Index (DXY) currently trades at 100.86, showing modest weekly weakness of -0.56% but monthly strength up 1.65%. A stronger dollar generally suppresses the global demand for gold by making it more expensive for foreign buyers, which explains why recent price declines have coincided with periods of DXY resilience despite weak US GDP growth data earlier in the quarter. This inverse relationship is critical to monitor as Fed forward guidance suggests rates may remain higher for longer if inflation persists above the 2% target.
Geopolitical tensions continue to provide a floor under gold prices, offering a safe-haven premium that partially offsets headwinds from real rate hikes. Recent headlines highlight how global instability can drive sudden spikes in demand even when fundamentals are muted. Investors must weigh these risk premiums against the structural drag of higher real yields and dollar strength as they position for potential volatility ahead of key data releases later this month.
Positioning and Market Flows
The CFTC Commitment of Traders (COT) report for XAU/USD futures reveals a net non-commercial position of 181,339 contracts, indicating strong speculative bullishness among large institutional traders who have increased their exposure by roughly 27,000 contracts over the past five weeks. This surge in long positioning suggests hedge funds and managed money are betting on sustained upside despite recent price weakness.
However, this futures-based optimism clashes with a clear negative sentiment from spot market investors as evidenced by gold ETF flows which recorded an outflow of approximately $1.97 billion last month. The reduction of 16 tonnes in total holdings indicates that retail and some institutional participants are selling shares to rebalance portfolios or seek yield elsewhere, creating a divergence between futures traders holding longs while ETF holders trim positions.
Central bank demand continues to provide a structural floor for the US gold market even as private sector flows turn mixed. While central banks have historically been net buyers over multi-year horizons driving global prices higher, their recent purchasing has moderated compared to previous years allowing retail sentiment more room to influence short-term price action in the USA
Correlated Assets
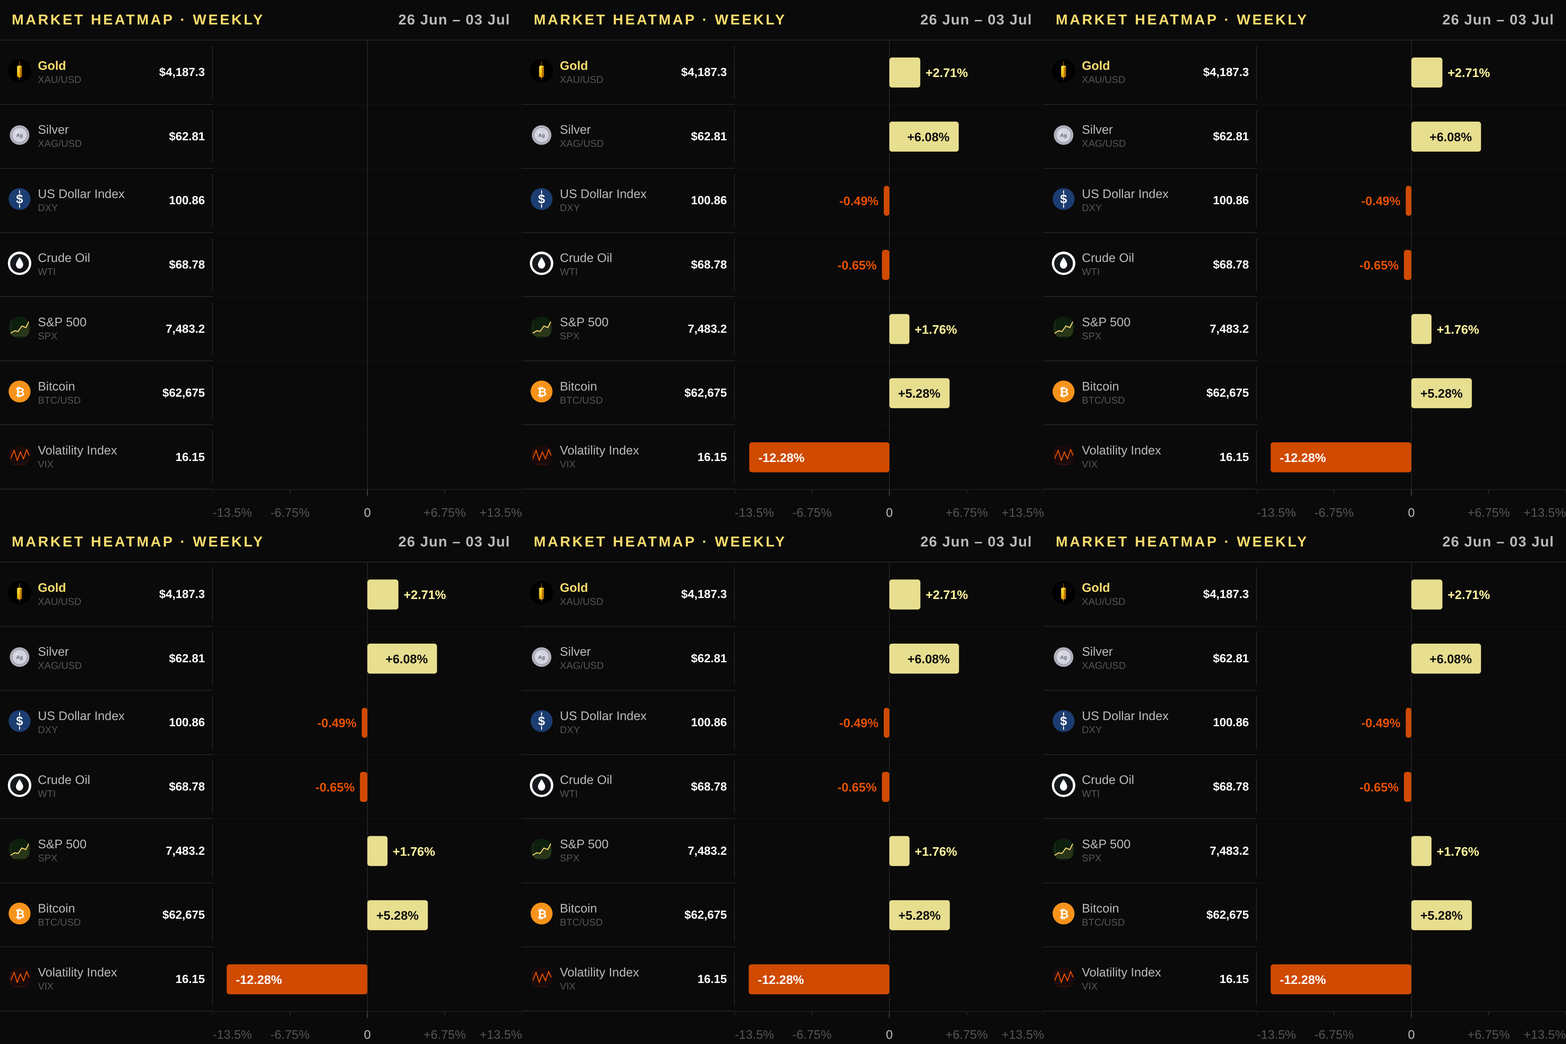
Gold's correlation with key macro drivers remains evident as investors assess risk premiums across asset classes for US gold market participants today. The DXY at 100.86 weakened slightly this week (-0.56%) while monthly gains of +1.65% suggest a broadly stronger dollar environment that typically suppresses global demand, even as the index trades near neutral territory. A weaker short-term trend supports the non-yielding asset by lowering its effective cost for foreign buyers, yet the broader monthly uptick in USD strength acts as a headwind against further upside momentum for spot gold prices.
The US10Y yield at 4.485% rose +2.12% this week, reflecting persistent inflation concerns with annual CPI holding near 4.3%. Rising nominal yields increase the opportunity cost of holding non-yielding assets like XAU/USD unless real rates fall to offset that pressure. The 10Y Real Rate (TIPS) at 2.25% has moved higher this month, reinforcing a bearish bias as investors price in slower rate cuts or potential hikes if inflation remains sticky above the Fed's mandate.
Silver (+6.08%) outperformed gold amid industrial demand hopes but faces its own supply-side constraints and macro drag from falling copper (-4.41%). Copper's decline signals broader recession fears that could dampen precious metals' industrial utility, creating a divergence between safe-haven flows for XAU/USD versus cyclical exposure in base metals like silver or copper. WTI oil at 68.78 fell -0.65% this week as geopolitical risks in the Middle East failed to sustain higher energy prices, reducing inflationary pressure on commodities and supporting real rate stability over time.
Equities (SPX) climbed +1.71%, indicating risk appetite that can compete with gold's safe-haven appeal when markets function normally. The VIX at 16.15 dropped -14.51% this week, reflecting reduced fear levels despite lingering geopolitical tensions; lower volatility reduces the premium investors demand for holding defensive assets like bullion during calm periods. Bitcoin rallied +4.22%, reinforcing its role as a speculative digital asset rather than a traditional safe haven relative to physical gold or sovereign debt instruments in times of stress.
Upcoming Catalysts
- CPI — 2026-07-14
- PPI — 2026-07-15
- GDP — 2026-07-30
These releases will provide critical data on inflation trends and economic growth, which influence Federal Reserve policy expectations and gold price direction in the US market.
Trading Idea
A short position on XAU/USD is recommended near USD 4195–4200 as price struggles to reclaim overhead resistance, with a stop loss placed at USD 4310 above the Bollinger Band upper band and recent high. The primary profit target sits at USD 3960 just below the key support level where sellers are expected to defend following this week’s broader macro backdrop. This strategy targets the continuation of the strong downtrend driven by rising real rates and persistent ETF outflows, aiming for a risk-reward balance that aligns with current technical structure. US investors can execute this view via SPDR Gold Shares (GLD) or iShares Gold Trust (IAU), trade COMEX gold futures on regulated exchanges, or allocate to physical bullion from established US dealers if avoiding leverage is preferred.
Price Outlook and FAQ
Gold price today USA is expected to trade between USD $4057.6 and USD $4317.0 tomorrow, with the 60-day high of USD $4879.7 as overhead resistance and support near USD $3962.5; the next week's bias remains bearish as ETF outflows weigh on sentiment.
Is gold currently an effective inflation hedge for US investors given recent CPI data? With annual consumer prices rising at 4.27%, a strong case exists for holding non-yielding assets if real rates stabilize, though current TIPS yields of 2.25% still impose some opportunity cost compared to historical lows seen during high-inflation regimes without Fed support.
How do Federal Reserve interest rate decisions and the yield on Treasury Inflation-Protected Securities (TIPS) influence gold prices? The inverse relationship between real rates and non-yielding assets means that any increase in TIPS yields directly suppresses demand for XAU/USD, while a cut in the Fed Funds Rate from its current 3.63% level would lower borrowing costs to boost speculative positioning.
What are the primary vehicles available for US investors seeking exposure to physical or paper gold? US-based retail and institutional buyers can access SPDR Gold Shares (GLD), iShares Gold Trust (IAU) via NYSE, purchase COMEX futures contracts on regulated exchanges, or acquire bullion directly from authorized dealers like APMEX, JM Bullion, and the US Mint.
This article is for informational purposes only and does not constitute investment advice or a financial recommendation. Investing in financial assets involves risk.
Key Takeaways for Traders
- Market Stance: The XAU/USD market remains bearish as price trades below all major moving averages with significant ETF outflows weighing on sentiment; traders should avoid new long entries until a decisive break above $4,200 occurs to invalidate the downtrend structure.
- Technical Level: Watch for rejection at the 50-day Simple Moving Average near USD 4,381 as primary overhead resistance, while holding support around USD 3,962 where further downside could accelerate if buyers fail to defend this zone.
- Macro Driver: Monitor rising real interest rates driven by persistent inflation above Fed targets, which continue to erode gold's non-yielding appeal and increase the opportunity cost of holding physical metal or shares in SPDR Gold Shares (GLD).
- Flow Signal: Large institutional outflows from US gold ETFs totaling nearly $2 billion this month contrast with net long futures positioning by hedge funds; however, sustained selling pressure in exchange-traded vehicles suggests a lack of broad-based investor demand for the precious metal right now.
- Risk Consideration: A sudden spike in geopolitical volatility or an unexpected Federal Reserve pivot toward aggressive rate cuts could reverse the current bearish bias quickly; maintain hedges via short positions on COMEX gold futures only if technical levels hold firm against fundamental shocks.
