Market Bias
Bearish. Gold is trading in a confirmed downtrend, currently below its 20-, 50-, and 200-day moving averages with an RSI of 43.7 indicating weakness despite a neutral MACD histogram reading. Real yields remain stable while the dollar index holds steady, creating persistent headwinds for the non-yielding asset. Institutional outflows from ETFs further underscore selling pressure as investors rotate into higher-yielding alternatives in this rate-sensitive environment.
Executive Summary
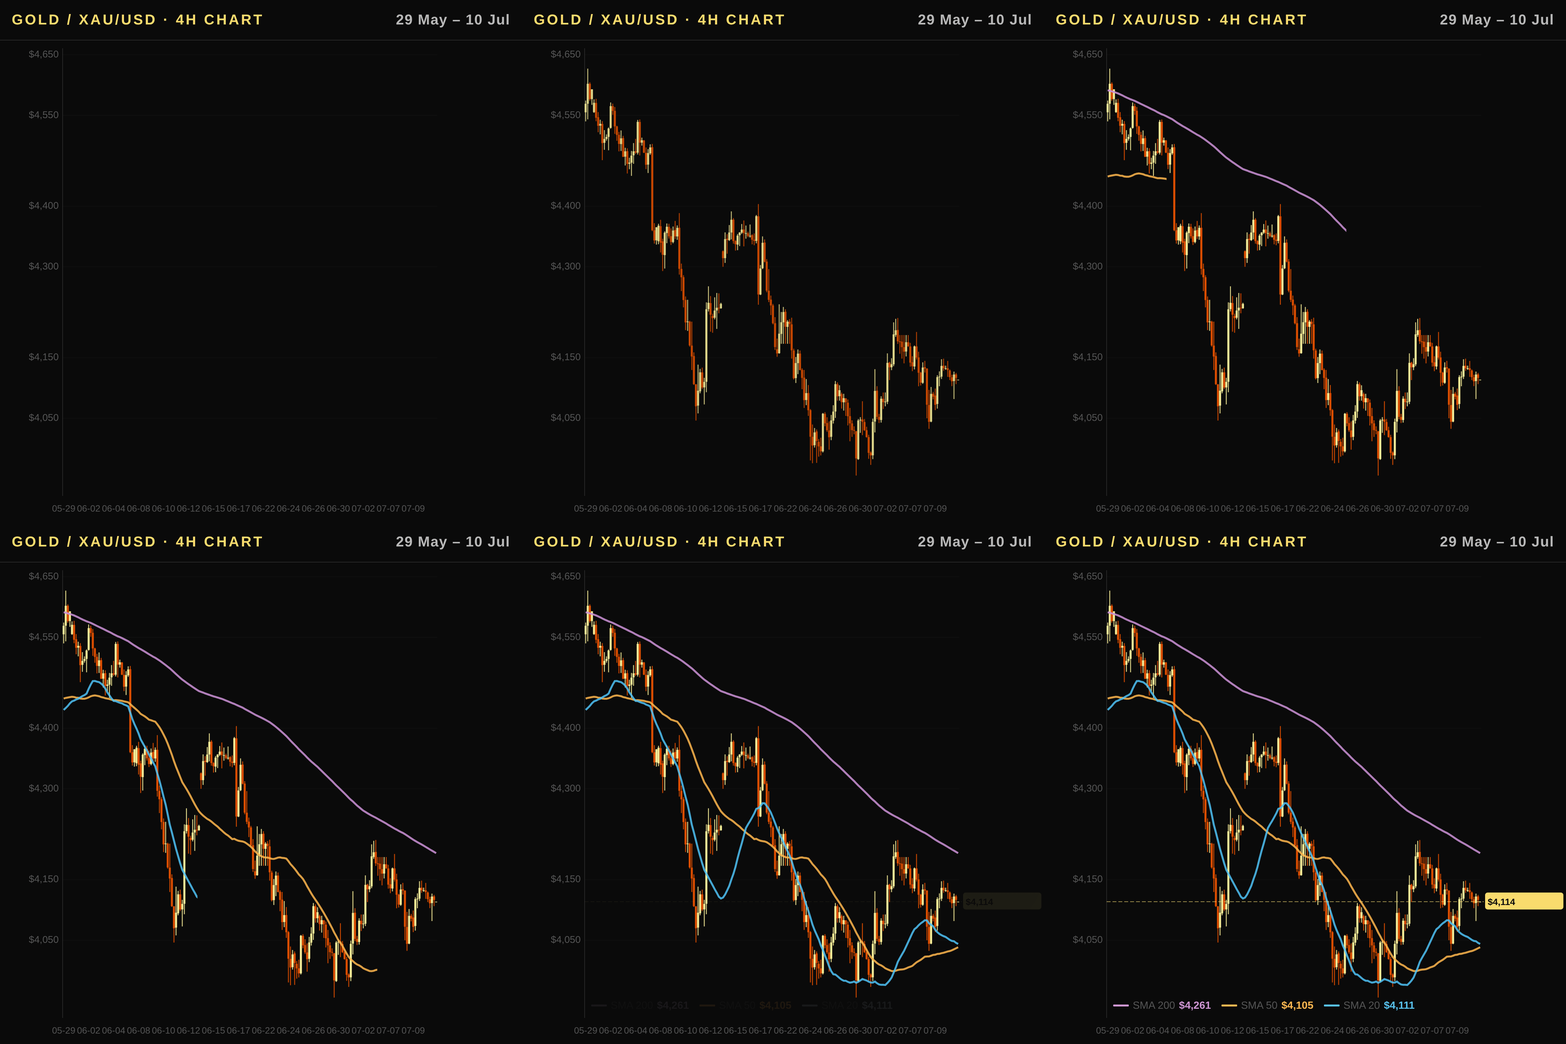
The US gold price today in the US is trading at $4,113.70/oz within a confirmed strong downtrend as of July 12, 2026. Despite a modest one-month gain of 0.57%, the metal has slipped -1.76% over the past week and remains well below its key moving averages, reflecting persistent macro headwinds from rising real rates and dollar strength. The US gold market is under pressure from net ETF outflows totaling approximately $2 billion in May 2026, which signal institutional caution despite a technically bullish COT futures positioning profile for non-commercial traders
US Outlook: Fed Policy, Real Rates, and Gold's Safe-Haven Premium
- Fed policy trajectory: The current Federal Reserve Funds Rate stands at 3.63%, with market expectations for further cuts in the coming months given the slowing inflation trend toward a more sustainable path.
- Real rates and gold dynamics: While the nominal US 10Y Treasury yield sits at 4.47%—a decline from prior highs—the critical metric is the real rate, reflected directly by the TIPS figure of 2.31%. These elevated but stable real rates increase the opportunity cost for holding non-yielding assets like gold, acting as a persistent headwind to prices in this US gold market context.
- Dollar impact: The US Dollar Index (DXY) is currently trading at 100.97 with minimal weekly movement of just 0.11% but notable monthly strength of 1.06%. A stronger dollar raises the effective cost for foreign buyers, suppressing global demand and creating a technical challenge for the spot gold price in USD today.
- Forward guidance: Recent FOMC language suggests patience before rate cuts if inflation remains sticky above the 2% target, implying that real rates could stay elevated longer than anticipated. This dovetails with US CPI data showing annual inflation at 4.27%, which keeps bond yields—and thus opportunity costs—for gold under upward pressure for now.
Technical Analysis
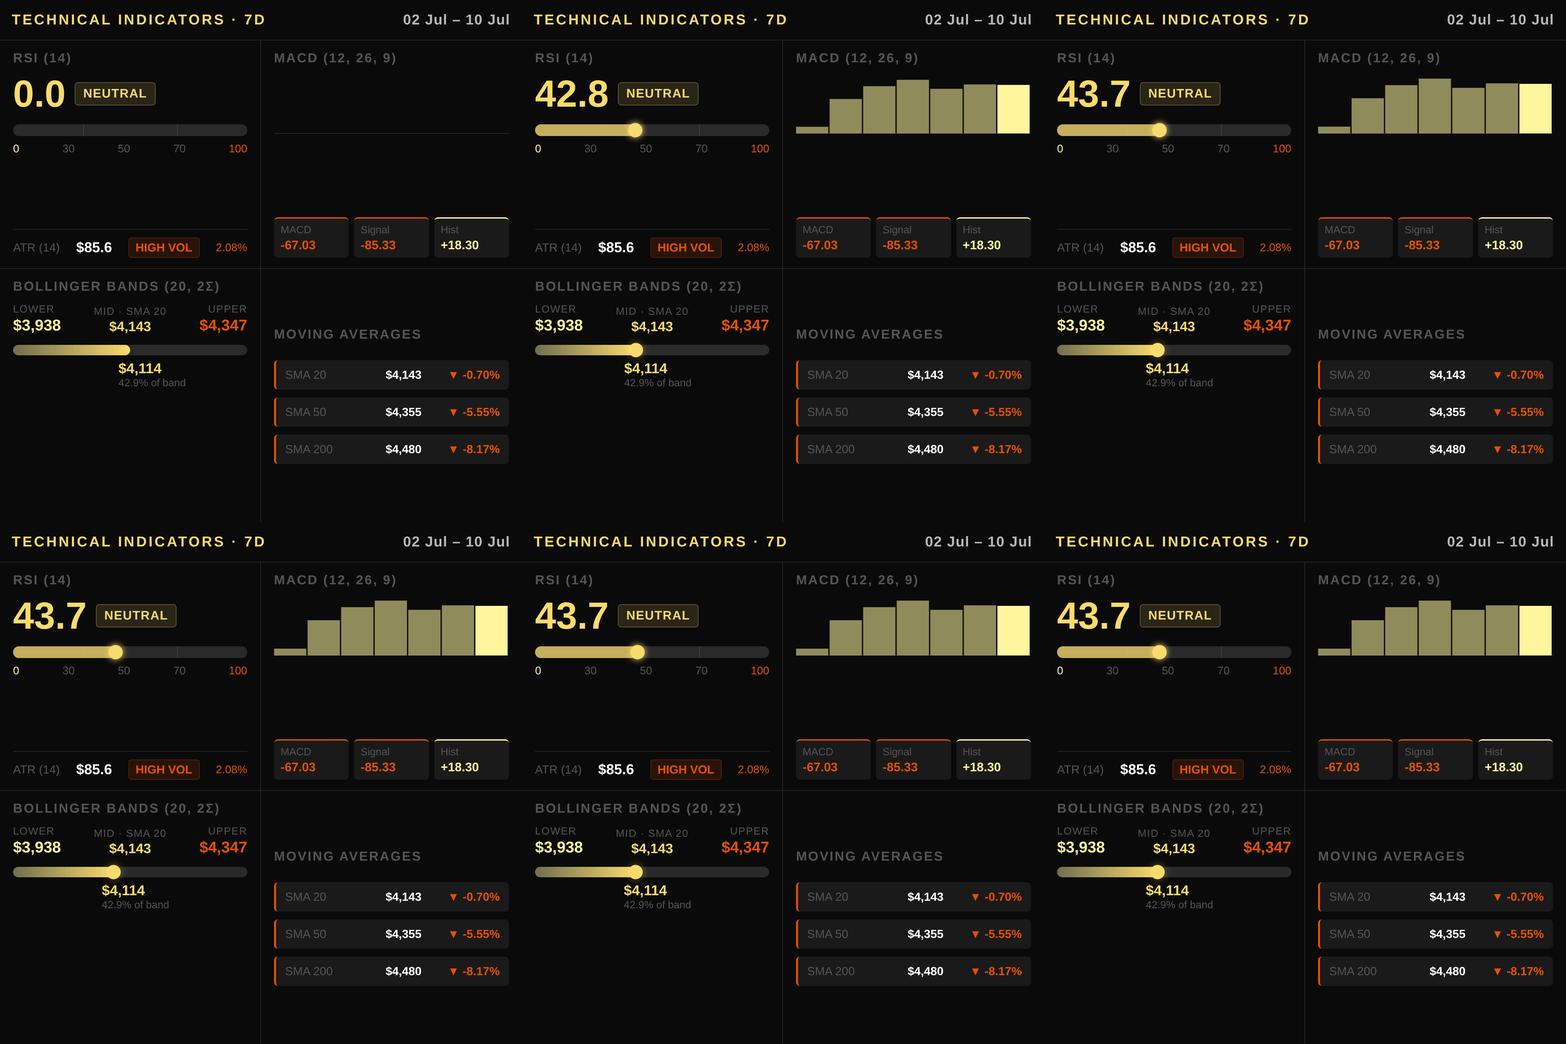
XAU/USD is currently executing within a strong downtrend, trading at $4,113.70 well below its 52-week high of $5,586.2 but finding support near the monthly low around $3,962.5. The immediate technical structure shows price pressure as the current level sits beneath all major moving averages: it trades under the SMA 20 at $4,142.8, and significantly below the SMA 50 ($4,355.3) and SMA 200 ($4,479.9), which act as heavy overhead resistance clusters. The Relative Strength Index (RSI) reads 43.7, positioning itself just below the neutral level of 50 and indicating bearish momentum that has not yet reached oversold territory; this suggests room for further downside before a potential mean reversion occurs. Momentum is confirmed by the MACD histogram, which registers at +18.3 despite negative line values (-67.03 vs -85.33 signal), hinting at short-term selling exhaustion but lacking enough force to trigger an immediate reversal near the Bollinger Band lower band of $3,938.2. Volatility remains contained within a tight range defined by the bands (Upper: $4,347.3, Middle: $4,142.8, Lower: $3,938.2) with an Average True Range (ATR) of $85.6 that limits breakout potential in this consolidation phase until a decisive break above the 20-day average occurs.
Macroeconomic Factors
US inflation remains stubbornly elevated at 4.27% annually, keeping real interest rates from falling deeply enough to trigger a major gold rally despite recent dips in nominal yields. The Federal Reserve holds its policy rate steady at 3.63%, while the 10Y Treasury yield has eased slightly to 4.47%. Crucially, the 10Y Real Rate (TIPS) stands at 2.31%, which is a bearish headwind for gold as it increases the opportunity cost of holding this non-yielding asset. A stronger US Dollar Index (DXY) reading of 100.97 further suppresses global demand by making XAU/USD more expensive for foreign investors, reinforcing the current downward pressure on prices. Geopolitical tensions in the Middle East and ongoing fiscal uncertainty continue to provide a modest safe-haven premium that partially offsets these fundamental drags. The yield curve remains normal with a 10Y-2Y spread of 0.35%, suggesting no immediate recession signal but limiting rate-cut expectations that could have boosted gold prices earlier this week.
Positioning and Market Flows
The CFTC Commitment of Traders report for gold futures shows non-commercial speculators holding a net long position of 194,246 contracts, a figure that has increased by over 20,000 contracts in the past five weeks. This rising speculative bias reflects bullish sentiment among hedge funds and managed money despite recent price declines, suggesting institutional players view current levels as attractive accumulation zones before anticipated policy shifts.
In contrast to futures positioning, the US gold ETF market is experiencing a notable outflow of approximately $1.97 billion this month after shedding 16 tonnes of holdings. These negative flows indicate that asset allocators are reducing paper exposure in favor of other instruments or physical holding strategies, introducing short-term selling pressure that may temporarily suppress spot prices even as futures sentiment remains constructive.
Central bank demand continues to provide a structural floor for the US gold market over multi-year horizons. While foreign central banks have not been active buyers recently, their ongoing accumulation trends historically offset periods of ETF weakness by maintaining steady institutional absorption at lower price levels whenever volatility spikes or real yields rise unexpectedly.
Correlated Assets
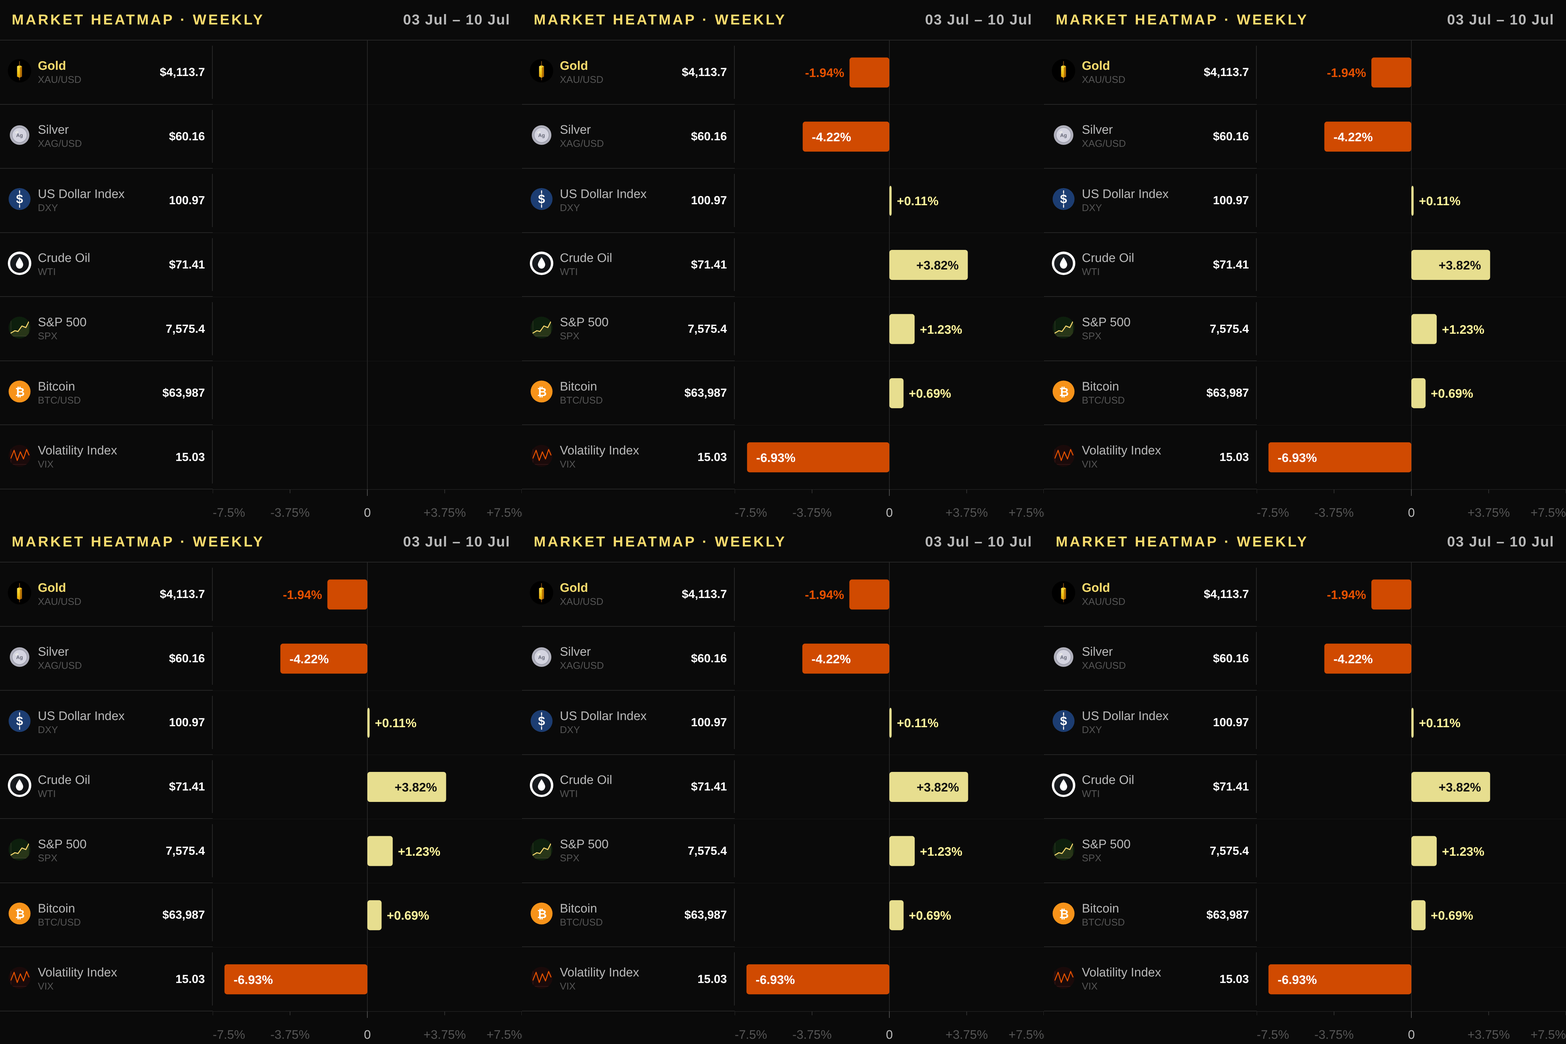
The strength of the US dollar is currently a primary headwind for gold, with the DXY holding steady at 100.97 and showing modest weekly gains; this strengthens the currency against non-yielding assets like XAU/USD. Meanwhile, the yield on the US 10Y Treasury sits at 4.569%, having risen slightly over the week to push borrowing costs higher for US borrowers while increasing gold's opportunity cost. In contrast, copper futures have advanced weekly by 0.93% to $6.282/lb and monthly gains of 0.37%, reflecting resilient industrial demand that supports a broader risk-on sentiment despite high interest rates. Silver remains the most volatile pair on this chart, having tumbled -4.22% over the week and declining further by -5.82% month-over-month to trade at $60.165/oz as investors rotate out of precious metals into industrial equities or riskier assets like Bitcoin, which recently added 1.09% weekly to reach a price near $63,987. WTI crude oil has surged 3.82% this week while sitting at $71.41/barrel and is up significantly monthly despite being down -18.58% over the last month; higher energy prices typically benefit gold by raising inflation expectations and geopolitical risk premiums. The S&P 500 (SPX) continues its upward trajectory with a weekly gain of 1.23%, indicating that equities remain attractive compared to cash, yet volatility remains contained as the VIX fell -6.93% this week to settle at just 15.03.
Upcoming Catalysts
- US Consumer Price Index — 2026-07-14: A release of inflation data could shift Fed rate-cut expectations, directly impacting real rates and gold prices if it deviates from forecasts.
- US Producer Price Index — 2026-07-15: Core PPI readings influence future CPI trends and corporate pricing power dynamics that support or dampen the bullish safe-haven thesis for non-yielding assets.
- US Gross Domestic Product — 2026-07-30: The GDP report will reveal whether economic resilience persists, altering risk-on sentiment and potential Fed policy shifts within the next month.
- US Non-Farm Payrolls — 2026-08-07: Strong employment figures would signal labor market durability while weak data could accelerate dovish central bank messaging favorable to gold buyers ahead of year-end positioning.
Trading Idea
Given the strong downtrend confirmed by price trading below all major moving averages and negative MACD momentum, a short position is favored with an entry zone between USD 4085 and USD 4160. A stop loss should be placed above USD 4230 to protect against potential volatility spikes near the upper Bollinger Band or rejection from immediate overhead resistance at USD 4347. The target for this trade is set at USD 3960, which aligns with recent support structure and offers a logical risk-reward ratio given current ATR levels. US investors can implement this directional view through COMEX gold futures for leverage efficiency or by shorting GLD shares while holding long positions in SPDR Gold MiniShares (GLDM) if hedging equity exposure is preferred, though physical delivery remains the ultimate safe-haven hedge against devaluation risks despite today's bearish technical setup.
Price Outlook and FAQ
Gold is expected to trade between USD 3,980 and USD 4,250 tomorrow as traders digest technical levels near support; over the coming week, XAU/USD retains a bearish outlook given price action below key moving averages.
Is gold still an effective inflation hedge for US investors when CPI is at 4.27%? While high nominal inflation typically supports bullion prices, real interest rates currently stand at 2.31%, which significantly boosts the opportunity cost of holding this non-yielding asset and dampens its hedging appeal relative to bonds. Investors must weigh rising consumer prices against the Fed’s restrictive stance before allocating capital to gold as a primary hedge today.
How do Federal Reserve decisions and real TIPS yields directly impact XAU/USD pricing? The inverse relationship between 10Y Real Rate (TIPS) yields and gold is mechanical: when real rates rise, bond returns improve relative to non-yielding assets like gold, exerting downward pressure on prices. Conversely, any shift in Fed guidance that lowers expectations for future rate cuts or pushes TIPS higher will immediately tighten the bid for XAU/USD.
What are the practical ways US investors can acquire physical gold and ETF exposure? Retail traders can gain immediate liquidity by buying shares of SPDR Gold Shares (GLD) or iShares Gold Trust (IAU), which trade on major NYSE exchanges with tight spreads; those preferring tangible assets may purchase bars from reputable dealers such as APMEX, JM Bullion, or the US Mint. Each vehicle offers distinct tax and logistical considerations for portfolio diversification within a standard brokerage account in the United States.
This article is for informational purposes only and does not constitute investment advice or a financial recommendation. Investing in financial assets involves risk.
Key Takeaways for Traders
- Market Stance: The gold market remains under clear bearish pressure as price trades below all major moving averages with a negative MACD line despite speculative net longs; traders should focus on short opportunities near resistance rather than chasing dips in this strong downtrend structure.
- Technical Pivot: Watch the 60-day high at $4,811.0 closely for rejection signals or trend exhaustion, while keeping an eye on the SMA 50 at $4,355.3 as immediate overhead resistance that defines the bearish channel ceiling this week.
- Macro Driver: Monitor real interest rates via the TIPS yield of 2.31% and Fed policy guidance for any shift toward rate cuts, which would reduce gold’s opportunity cost and potentially reverse its current decline driven by higher yields and a resilient dollar.
- Flow Signal: ETF outflows totaling $-1,969 million over the month confirm institutional selling pressure that outweighs speculative bullish positioning in futures markets; central bank demand remains steady but is insufficient to offset this sustained capital rotation away from paper gold exposure.
- Risk Consideration: Geopolitical tensions or a sudden spike in oil prices could temporarily boost safe-haven flows, yet without real rate declines or dollar weakness, such moves are likely short-lived and should not be treated as sustainable entry points for long positions.
