Market Bias
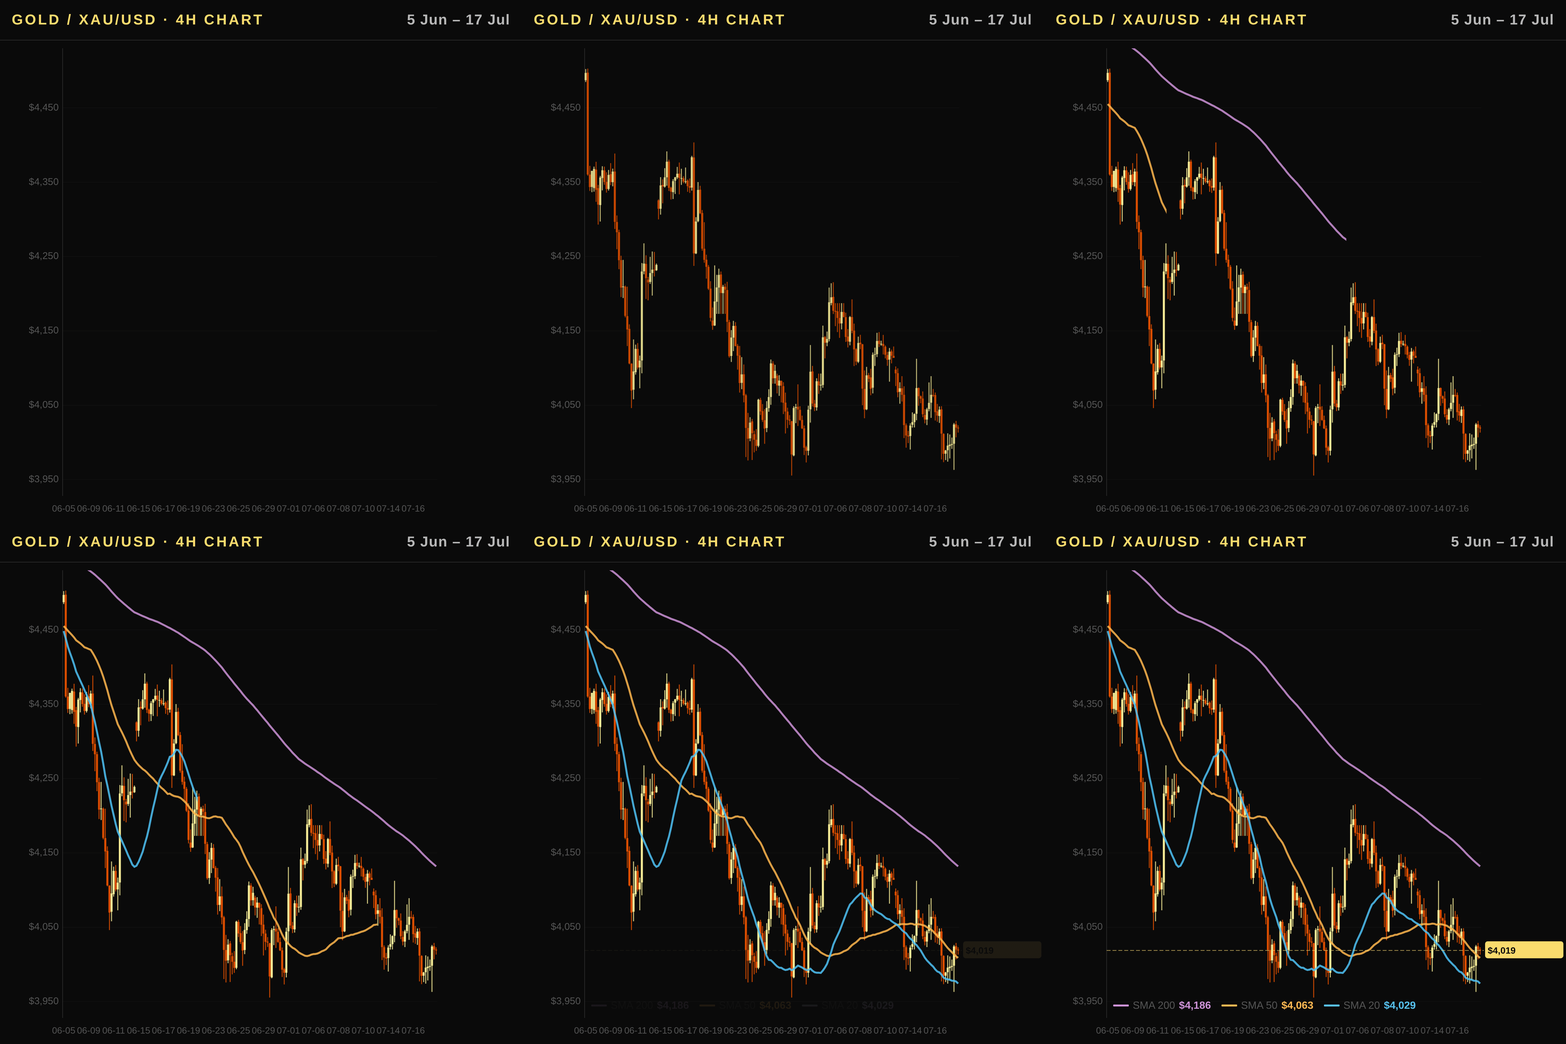
Bearish. Gold is currently trading below all major moving averages with a negative MACD line, reflecting strong downside momentum despite a rising histogram that merely eases selling pressure. The 1-week loss of -2.23% and the broader downtrend confirm weak near-term demand as real rates rise and the dollar strengthens.
Executive Summary
The gold price today in the US stands at $4,012.7 per ounce as investors navigate a mix of persistent inflation pressures and cautious Federal Reserve expectations that are weighing on sentiment for this non-yielding asset. Despite strong year-to-date performance of 18.23%, recent declines over one week (-2.23%) and the past month (-5.0%) reflect growing bearish pressure as rising real interest rates increase the opportunity cost of holding gold in a high-rate environment. ETF outflows totaling approximately $9 billion this month underscore institutional selling, which contrasts with bullish COT futures positioning where non-commercial traders have accumulated net long positions despite broader market weakness. US investors monitoring the gold price today USA must weigh these conflicting signals while watching for shifts in real rates and dollar strength that could reverse current downside momentum over the next few weeks.
US Outlook: Fed Policy, Real Rates, and Gold's Safe-Haven Premium
- Fed policy trajectory: The Federal Reserve Funds Rate stands at 3.63%, with market expectations currently pricing in a gradual easing path over the coming months as inflation data stabilizes near the central bank’s target.
- Real rates and gold: The 10Y Real Rate (TIPS) has risen to 2.35% recently, increasing the opportunity cost of holding non-yielding assets like XAU/USD; this dynamic acts as a significant headwind for the current US gold market trend.
- Dollar impact: A stronger US Dollar Index at 100.75 increases the effective price of bullion for international buyers, which suppresses global demand and weighs on the spot gold price in USD.
- Federal Reserve forward guidance: The most recent FOMC statement suggests that policy pivots will remain data-dependent, implying that any unexpected uptick in inflation could delay rate cuts and further pressure precious metals prices.
Technical Analysis
Gold (XAU/USD) is currently trading at $4,012.7, firmly within a strong downtrend as it sits below all major moving averages. The price action remains suppressed by overhead resistance near the SMA 50 and SMA 200, with immediate support found just above recent lows around $3,962.
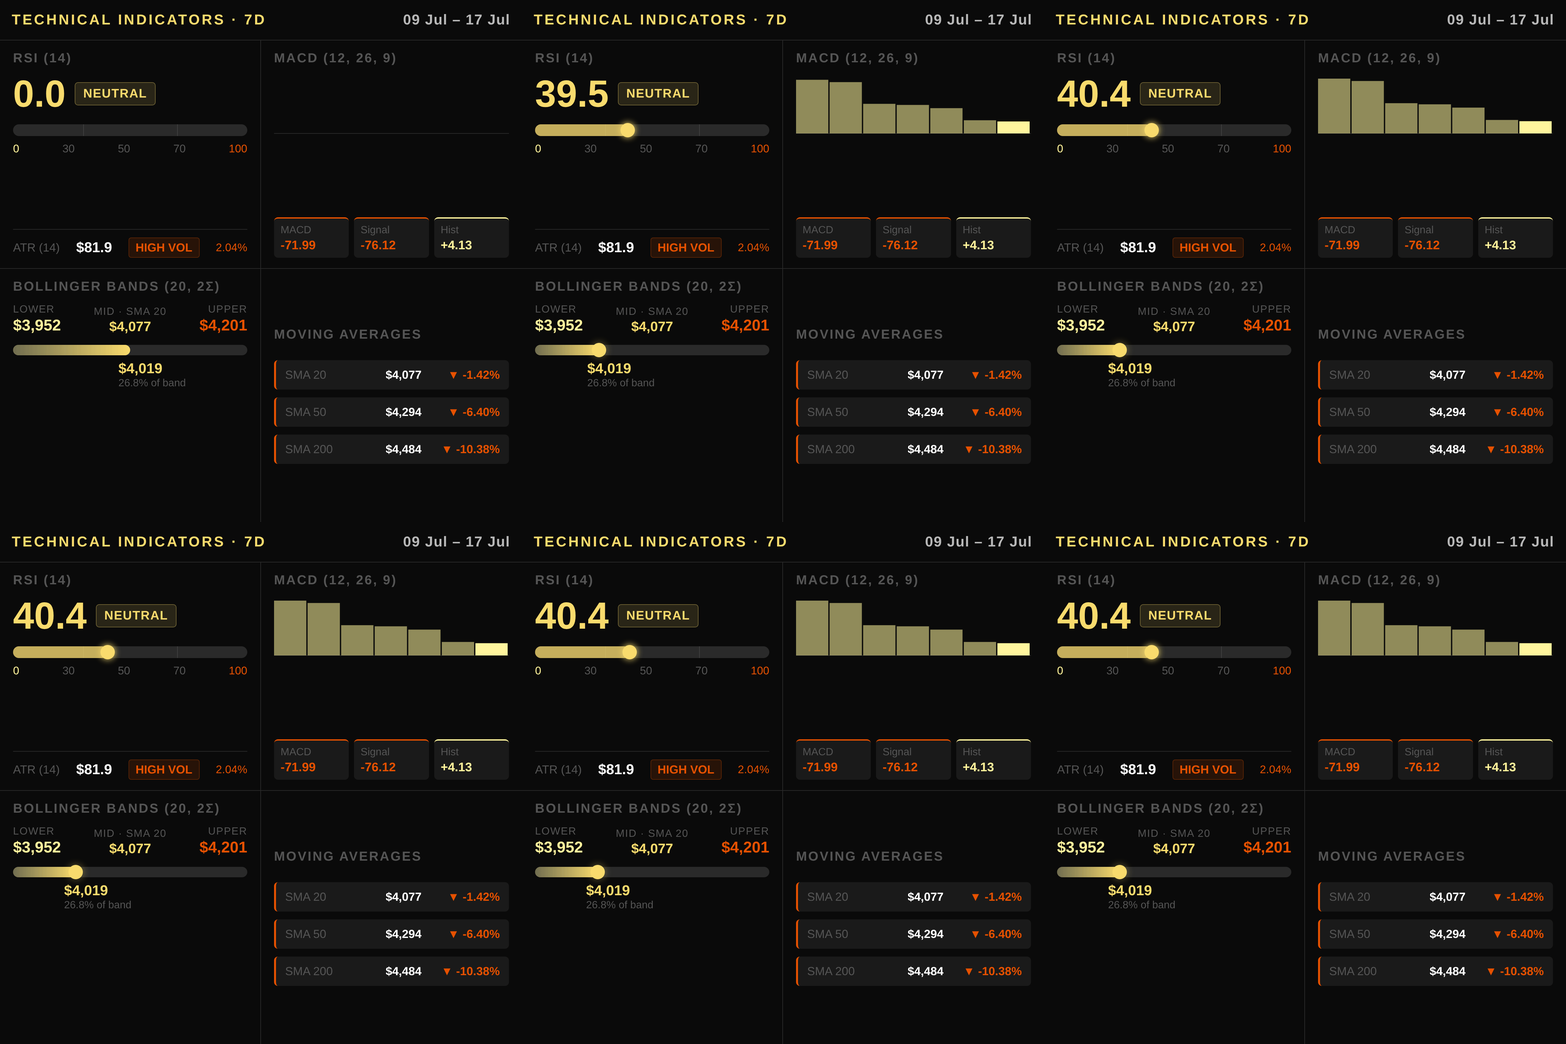
The technical structure confirms bearish momentum because the current price is trading beneath both the SMA 50 at $4,293.6 and the longer-term SMA 200 at $4,484.1, while holding just above the more responsive SMA 20 at $4,076.6. This configuration indicates that short-term buyers are defending a key support zone but lack conviction to reclaim medium-term averages yet.
Momentum oscillators reflect this weakness with an RSI (14) reading of 40.4, placing the asset below the neutral level of 50 and in weak territory rather than oversold conditions. The MACD histogram shows a value of +4.13, which suggests that while the primary trend remains negative, recent selling pressure is moderating slightly as the green bars narrow, though the MACD line (-71.99) and signal (-76.12) both remain well below zero.
Volatility metrics suggest caution for short-term traders given an ATR (14) of 81.9. The asset trades within a Bollinger Band range defined by an upper band at $4,201.1, a middle band coinciding with the SMA 20 at $4,076.6, and a lower bound near $3,952.0. A break below the $3,952 support could accelerate downside toward the next support zone in US dollars.
Macroeconomic Factors
The US Federal Reserve holds its funds rate steady at 3.63%, with market expectations for cuts remaining muted amid persistent inflation data showing CPI at 3.73%. This policy stance has pushed real interest rates higher, as the 10Y Real Rate (TIPS) climbed to 2.35% over recent weeks—a clear headwind for gold by increasing the opportunity cost of holding this non-yielding asset. The yield curve remains normal with a positive spread between the 10-year and 2-year Treasury yields at 0.37%, signaling no immediate recession risk that would typically boost safe-haven demand. Meanwhile, the US Dollar Index (DXY) has edged up to 100.75 this month despite minor weekly fluctuations, which raises gold’s effective price for non-US buyers and dampens global appetite. Geopolitical tensions in the Middle East continue to provide a modest risk premium, but these are increasingly being priced into oil markets rather than driving broad bullion demand away from yield-bearing assets like US Treasuries or equities.
Positioning and Market Flows
The CFTC Commitment of Traders report reveals a net speculative long position in gold futures totaling 186,682 contracts, indicating bullish sentiment among large institutional managers who are accumulating positions ahead of potential upside moves. This growing non-commercial bias contrasts sharply with the commercial sector’s heavy short hedge of -214,788 contracts, which reflects producers and banks protecting against price declines rather than betting on rallies.
Meanwhile, exchange-traded fund flows have turned decisively negative this month as investors pulled out roughly $9.19 billion worth of shares from gold ETFs like GLD and IAU. These substantial outflows signal that retail and some institutional buyers are rotating into other assets despite the metal’s strong year-to-date performance, a flow backdrop that could cap further price advances until sentiment shifts back in favor of paper gold ownership.
Central bank demand continues to provide a structural floor for prices as global central banks add to their reserves amid geopolitical instability and currency diversification goals. However, the combination of ETF outflows rising sharply this month suggests that private sector appetite is currently overwhelmed by selling pressure from profit-taking or portfolio rebalancing in the US market.
Correlated Assets
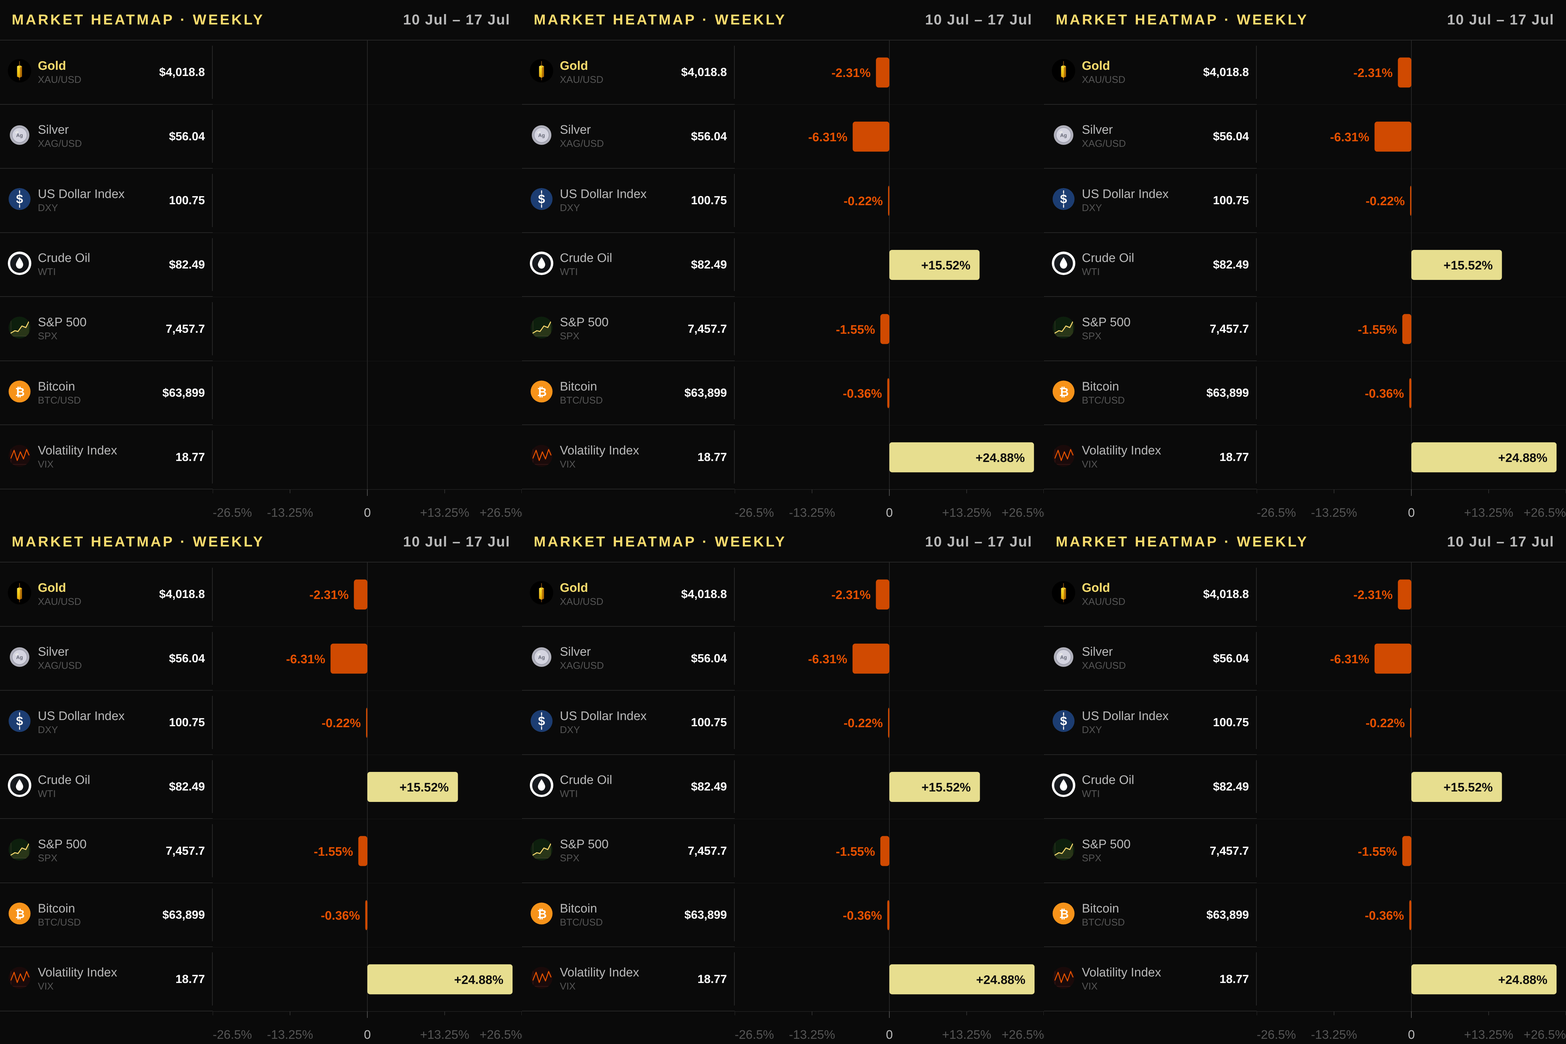
Gold’s inverse relationship with the US Dollar Index (DXY) is currently being tested, as the dollar has firmed +1.22% over the past month to 100.75; that strength raises gold's effective cost for non-US buyers and caps upside momentum. The ten-year Treasury yield sits at 4.47%, down marginally last week yet still elevated relative to historical averages, which continues to cap gold’s rally by increasing the opportunity cost of holding this non-yielding asset alongside bonds yielding near 4%. Real rates measured via TIPS have ticked up to 2.35%, further tightening borrowing costs and pressuring prices despite recent technical weakness in equities. Silver is underperforming significantly, falling -6.31% weekly as industrial demand concerns outweigh precious metal safe-haven flows. Copper has slipped -0.22% on the week amid global manufacturing slowdown fears, while WTI crude oil stands out with a sharp +7.69% monthly gain driven by Middle East conflict risks that simultaneously boost energy prices and geopolitical premiums for gold. The S&P 500 (SPX) remains in correction territory at 7457.7, down -1.55% weekly, a risk-off signal that has so far failed to translate into sustained bullion demand. Investor anxiety is reflected in a rising VIX fear gauge now at 18.77, up +24.88% over the past month, which typically coincides with increased gold allocation by retail and institutional portfolios seeking portfolio insurance. Bitcoin continues its independent trajectory near $64,148, gaining 3.07% this week as digital assets decouple from traditional safe-haven narratives; however, it remains a speculative alternative rather than a direct substitute for physical or ETF-backed gold in conservative US investor accounts.
Upcoming Catalysts
- US Gross Domestic Product — 2026-07-30: A key gauge of US economic health that influences growth expectations and Fed rate-cut timing for gold buyers in the US market.
- US Non-Farm Payrolls — 2026-08-07: The monthly jobs report will shape labor market sentiment, impacting inflation forecasts and real interest rates critical to the XAU/USD trend.
- US Consumer Price Index — 2026-08-12: This CPI release determines near-term inflation expectations, directly affecting how investors price in future Fed policy moves for gold prices today USA.
- US Producer Price Index — 2026-08-13: The PPI provides early signals on wholesale cost pressures that could alter the trajectory of consumer inflation and subsequent central bank action impacting the US gold market outlook.
Trading Idea
Traders should initiate short positions in XAU/USD near $4035, with a stop loss placed above recent resistance at $4120 to guard against sudden safe-haven inflows if geopolitical tensions flare unexpectedly. The primary target for this bearish setup is the immediate support zone around $3960, where downside momentum should accelerate as price struggles beneath rising overhead moving averages. US investors can execute this strategy by selling shares of SPDR Gold Shares (GLD) or iShares Gold Trust (IAU) on major exchanges, utilizing COMEX gold futures for direct exposure, or holding physical bullion from reputable dealers like the US Mint.
Price Outlook and FAQ
Gold is expected to trade between $3910 and $4125 tomorrow as it navigates below its key moving averages, with a bearish one-week bias persisting until price reclaims the $4076.6 support zone or macro data shifts sentiment sharply for the US gold market.
Is gold still an effective inflation hedge in 2026 given current CPI and real rates? With annualized US consumer prices rising at 3.73%, gold maintains its traditional hedging role, though high yields complicate the picture by offering alternatives; however, since the 10-year TIPS yield sits at 2.35% rather than matching headline inflation directly, investors often still favor gold to preserve purchasing power against real rate volatility and currency debasement risks inherent in a slowing US economy.
How do Federal Reserve decisions and real interest rates specifically impact XAU/USD pricing? Gold prices typically fall when the Fed signals hawkishness or if 10-year TIPS yields rise, as higher opportunity costs make holding this non-yielding asset less attractive; conversely, dovish commentary that lowers borrowing costs in USD generally supports the gold price by reducing real rates and strengthening its appeal to US investors seeking yield-free returns.
What are the primary ways for American residents to purchase physical or digital gold assets today? US-based individuals can allocate capital via SPDR Gold Shares (GLD) or iShares Gold Trust (IAU) listed on NYSE exchanges, trade COMEX futures through regulated brokers, or buy sovereign coins and bars from reputable US dealers such as APMEX, JM Bullion, or the official United States Mint to hold in personal safe storage.
This article is for informational purposes only and does not constitute investment advice or a financial recommendation. Investing in financial assets involves risk.
Key Takeaways for Traders
- Market Stance: The XAU/USD market remains bearish as price trades below all major moving averages and RSI at 40.4 sits below the neutral 50 level; traders should maintain defensive positions until a confirmed break above the SMA 20 signals trend reversal.
- Key Technical Level: Watch the SMA 20 at USD $4,076.6 acting as immediate overhead resistance while monitoring support at USD $3962.5 where buyers may defend against further declines toward the 60-day low.
- Macro Driver: Monitor real interest rates via TIPS yields and Fed policy guidance closely; rising real rates increase gold’s opportunity cost, reinforcing downside momentum unless inflation data forces a dovish pivot in near-term expectations.
- Flow Signal: Be cautious of persistent ETF outflows reflecting institutional selling pressure despite bullish COT positioning from speculative traders, indicating divergence between retail sentiment and broader investor behavior that could suppress prices further.
- Risk Consideration: Geopolitical tensions offer potential short-lived safe-haven support but should not offset the prevailing macro headwinds; hedge long-term portfolios with physical gold only if real rates stabilize or turn lower before entering new positions.
