Market Bias
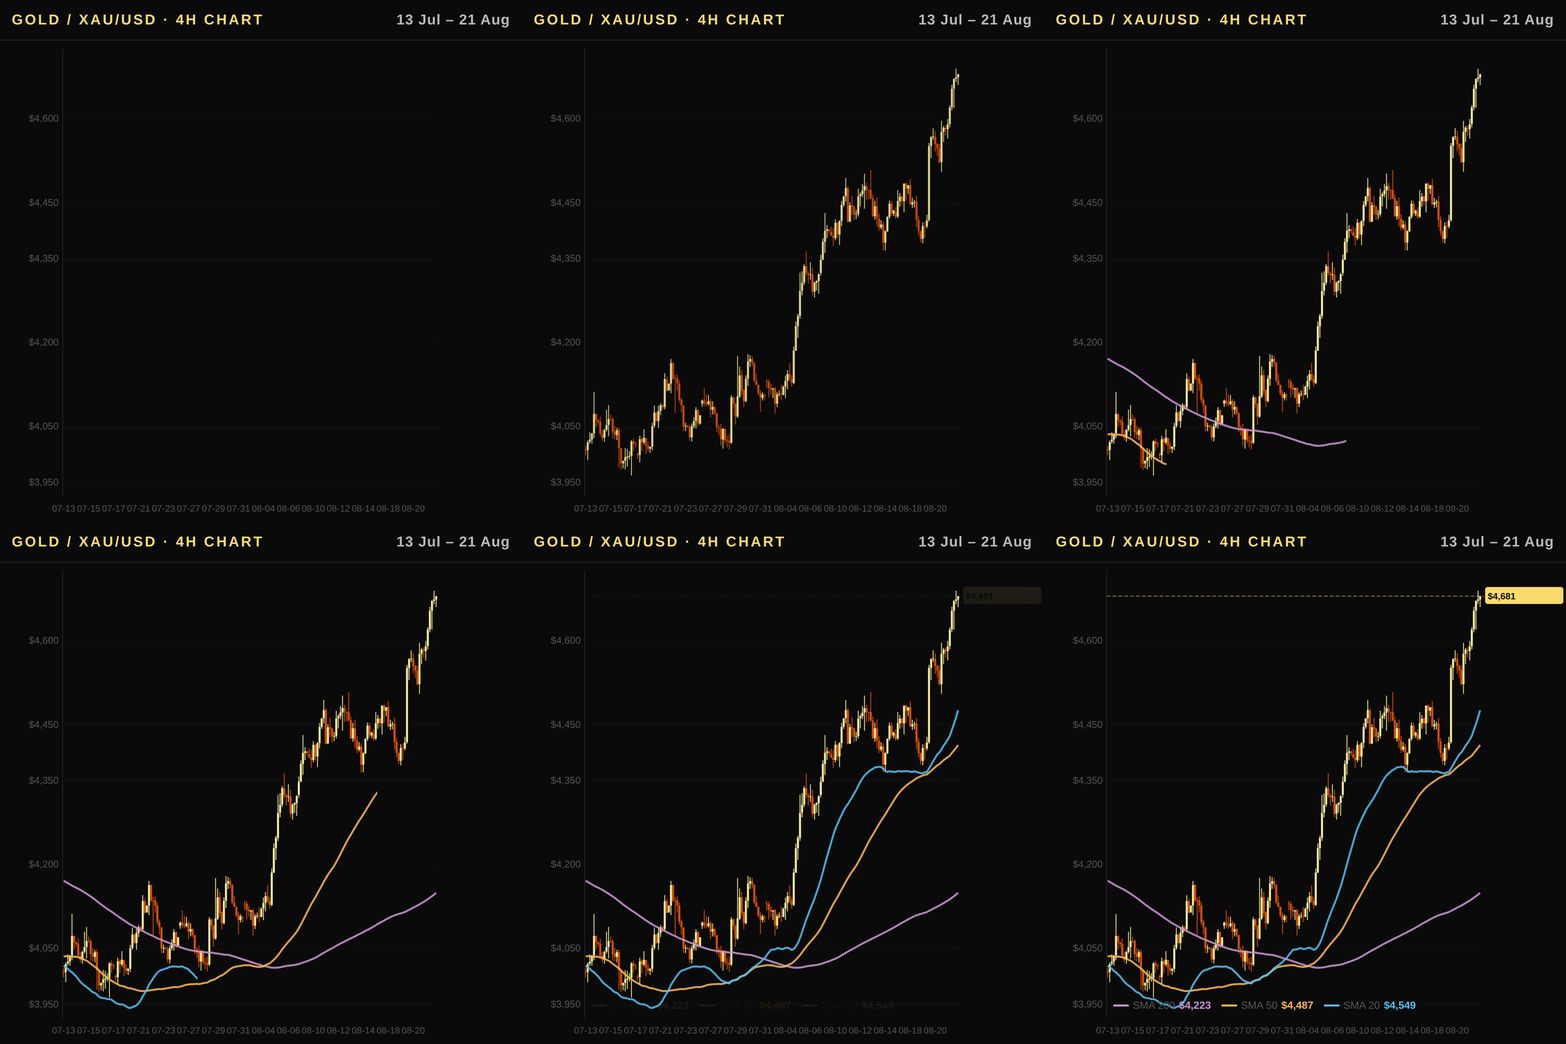
Bullish. The current price of $4,624.1 is trading well above the 20-, 50-, and 200-day moving averages, while RSI at 73.8 indicates strong bullish momentum despite approaching overbought territory. A positive MACD histogram of 34.03 confirms rising upward momentum within a confirmed uptrend, and the 1-week gain of 5.56% reflects robust demand ahead of key macro data releases. While real rates have stabilized near 2.35%, providing a steady floor for prices, the technical structure remains firmly bullish with immediate resistance at today’s high and support anchored near the 60-day low.
Executive Summary
Gold price today in the US (USD) is trading at $4,624.1, reflecting a strong uptrend with a 5.56% gain over the past week. The gold price today USA remains supported by surging ETF inflows of $2.97 billion this month and a weakening dollar, which lowers the effective cost for international buyers. While real rates have stabilized near 2.35%, the primary driver is currently geopolitical risk-off sentiment and the technical breakout above key moving averages. Investors focusing on the US gold market should monitor upcoming macro data releases that could influence Fed policy expectations over the next month.
US Outlook: Fed Policy, Real Rates, and Gold's Safe-Haven Premium
- Fed policy trajectory: The Federal Reserve maintains a funds rate of 3.63%, effectively holding steady as markets anticipate a potential pause or eventual cuts in the coming quarter. This stance limits immediate inflationary pressure but keeps the opportunity cost for holding non-yielding gold elevated relative to bond yields.
- Real rates and gold: With the 10Y Real Rate (TIPS) standing at 2.35%, investors face a persistent headwind as positive real interest rates increase the yield advantage of Treasury bonds over physical bullion. However, the 10Y Treasury nominal yield has risen to 4.6%, reflecting inflation expectations that partially offset the real rate impact on gold pricing.
- Dollar impact: The US Dollar Index (DXY) is currently at 98.8 and has weakened over the past month by 2.59%. A softer dollar reduces the effective price of XAU/USD for foreign buyers, acting as a bullish catalyst for global demand despite domestic rate pressures.
- Federal Reserve forward guidance: Recent FOMC communications suggest a data-dependent approach, where any shift from the current 3.63% policy rate will be driven by CPI and employment readings. A dovish pivot in Fed rhetoric would immediately lower real rates, providing the strongest fundamental support for the US gold market in the next 1-3 months.
- US inflation and GDP context: Annual CPI remains sticky at 3.54%, which is above the Federal Reserve's 2% target, complicating rate cut timing. Meanwhile, robust GDP growth of 2.2% indicates a resilient economy that could sustain higher rates longer than anticipated, creating a complex backdrop for the gold price today in the US.
Technical Analysis
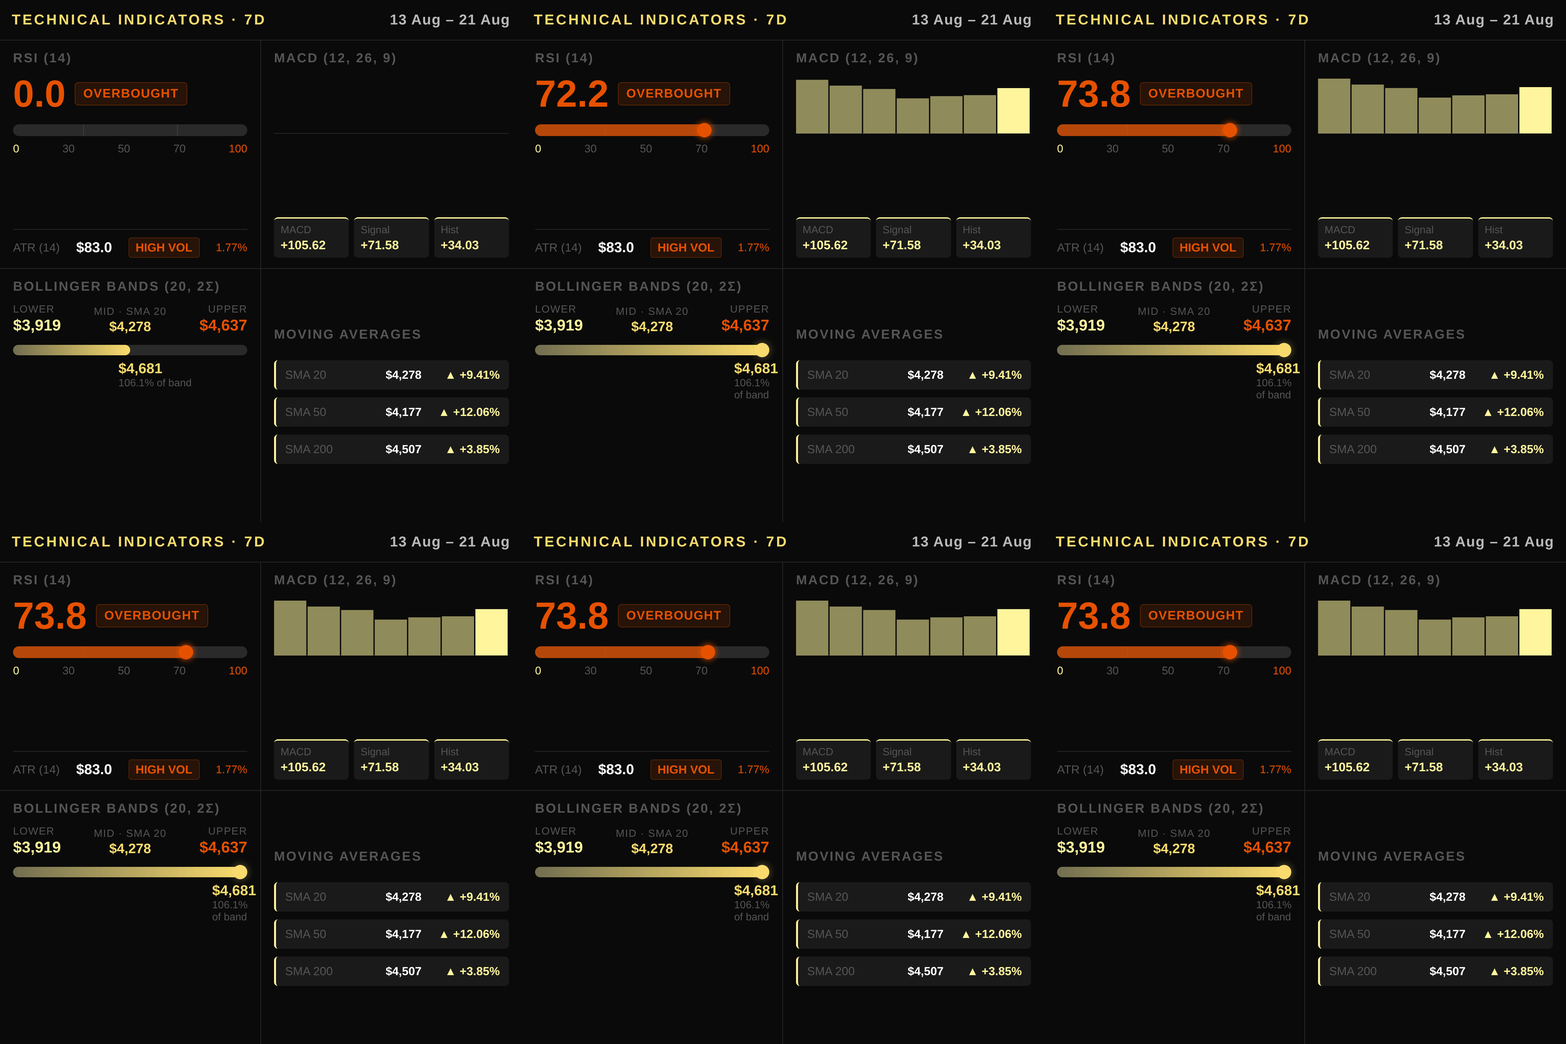
Gold is trading at $4624.1, positioned just below the upper Bollinger Band at $4637.0 while sitting right at its 60-day high resistance of $4624.1. The price sits comfortably above the 20-day simple moving average (SMA) of $4278.2 and the 50-day SMA of $4177.0, and above the 200-day average at $4507.0, which now acts as the nearest support and confirms the uptrend across every major timeframe. The Relative Strength Index (RSI) registers at 73.8, signaling that the asset is in overbought territory and vulnerable to a pullback toward neutral levels. Momentum remains intact with the MACD histogram posting a positive value of 34.03, suggesting buying pressure persists despite the elevated RSI reading. The Average True Range (ATR) stands at 83.0, reflecting moderate volatility that could fuel intraday swings around key technical thresholds. Traders should watch for a break above $4637.0 to confirm continuation of the strong uptrend or a rejection from current resistance levels as profit-taking intensifies near the upper Bollinger Band.
Macroeconomic Factors
The Federal Reserve’s policy stance remains a primary driver for the US gold market, with the Fed Funds Rate currently held at 3.63%. While nominal yields have risen slightly, real rates—measured by the 10Y Real Rate (TIPS) at 2.35%—have remained largely stable, limiting the opportunity cost headwind for non-yielding gold. A sustained rise in these real rates would act as a bearish pressure on prices, whereas stability or declines would support a bullish trajectory. The US Dollar Index (DXY) has weakened over the past month, dropping 2.59%, which reduces the effective cost of gold for foreign buyers and boosts global demand in the gold price today USA context. This divergence between a cooling dollar and resilient gold prices reinforces the safe-haven appeal. Geopolitical tensions continue to provide a structural floor for the metal, as investors seek assets that preserve value during periods of uncertainty. The yield curve remains normal with the 10Y-2Y spread at 0.5%, indicating no immediate recession risk that would typically trigger a sharp flight to safety. Central bank demand provides a steady undercurrent, though it has not been enough to fully offset recent speculative outflows in other assets.
Positioning and Market Flows
COT data for XAU/USD futures indicates a robust speculative bias, with non-commercial net longs at 222,189 contracts and a positive weekly change of 38,279. This accumulation by hedge funds and managed money confirms strong bullish sentiment among major financial institutions, distinct from commercial hedgers who hold a significant short position to offset production risk.
Meanwhile, ETF flows continue to provide substantial institutional support. Recent net inflows totaling approximately $2.97 billion reflect a clear appetite for physical-backed exposure, reinforcing the thesis that demand is concentrated in asset classes offering tangible value rather than speculative digital tokens. This structural buying pressure helps stabilize prices even when futures positioning faces short-term volatility.
Central bank purchases remain a critical underlying factor driving the gold market higher over multiple years. As global reserves diversify away from fiat currencies, this persistent structural demand creates a firm price floor for XAU/USD, ensuring that supply shocks or macro stress do not easily precipitate prolonged declines.
Correlated Assets
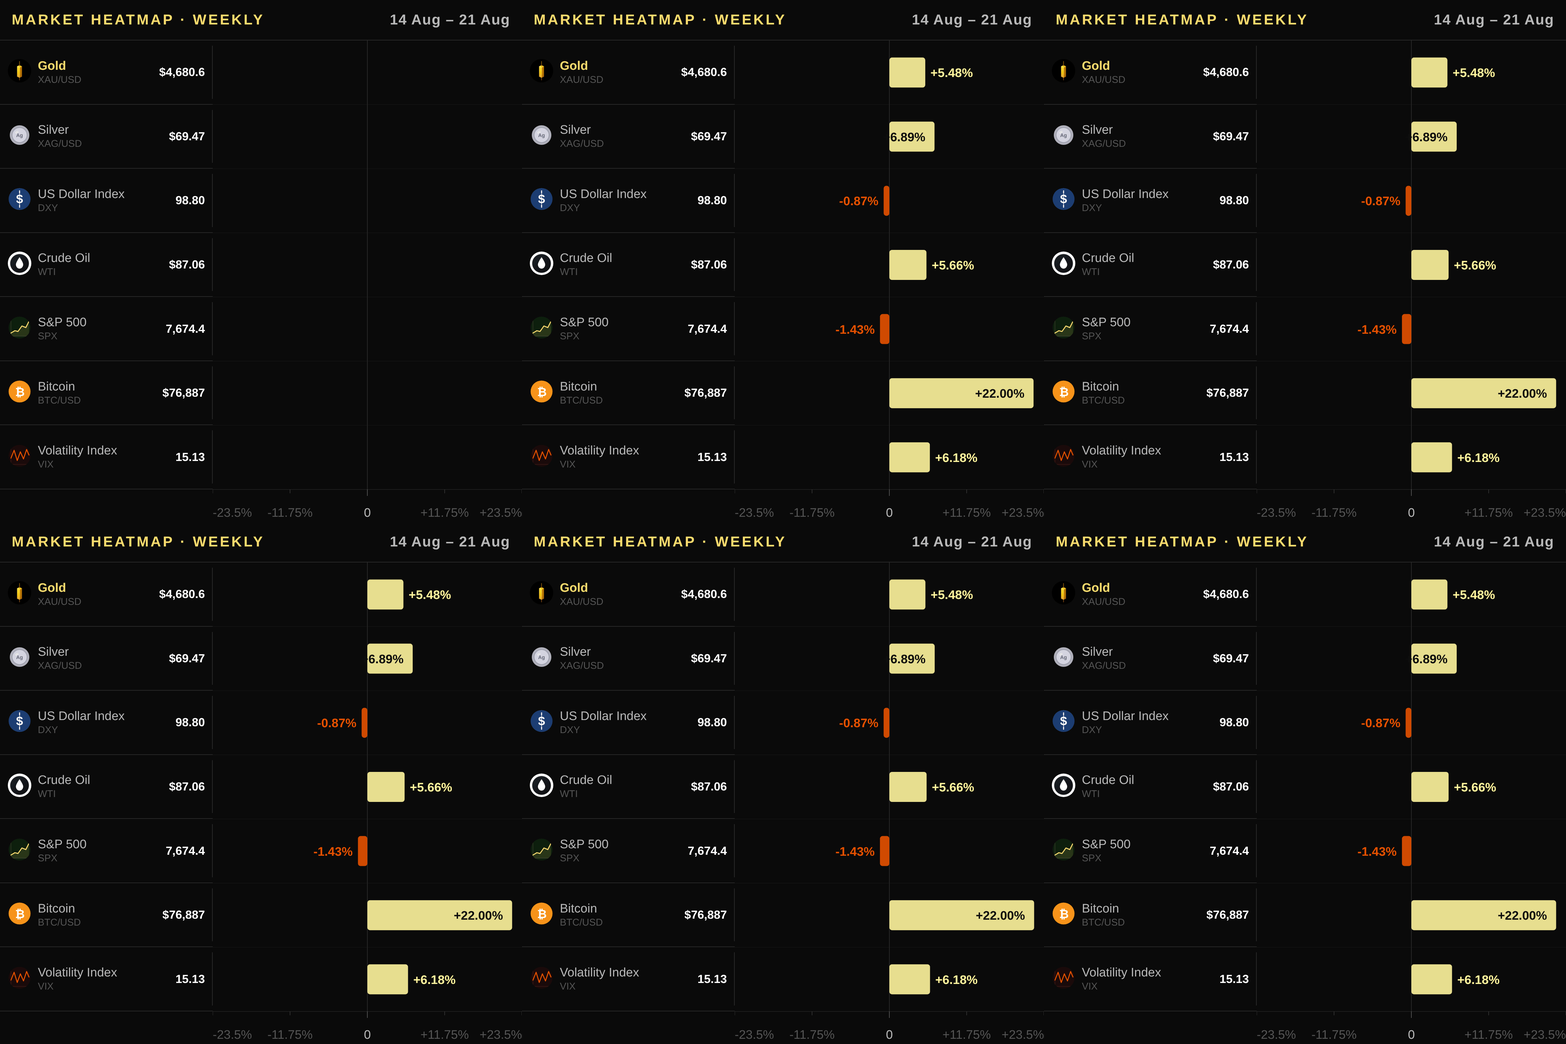
Gold's correlation with the US Dollar Index (DXY) remains inverse; as the DXY fell 0.87% this week to 98.8, gold prices in USD rose, confirming the dollar's drag on global demand is easing. The US 10Y Treasury yield advanced 0.89% to 4.738%, increasing the opportunity cost of holding non-yielding gold and acting as a headwind despite the asset's strong momentum. Silver surged 6.89% weekly to $69.466/oz, outperforming gold due to industrial demand drivers, though its monthly gain of 20.19% reflects broader commodity strength. WTI oil climbed 5.66% to $87.06/barrel, supporting geopolitical risk premiums, while copper held steady at $6.5795/lb with a slight weekly dip offset by a robust monthly rise of 4.35%. The S&P 500 (SPX) slipped 1.43% to 7,674.37, contrasting gold's rally as equities retreated on profit-taking. The VIX spiked 6.18% to 15.13, signaling renewed market anxiety that often fuels safe-haven flows into bullion. Bitcoin jumped 19.19% weekly to $76,887, outpacing gold on the week as a high-beta risk asset, though it remains distinct from gold's monetary role. Copper's monthly strength suggests industrial recovery, providing a partial floor for non-gold precious metals even as the Fed pauses rate cuts.
Upcoming Catalysts
- US Gross Domestic Product — 2026-08-26: This release will confirm whether economic growth is stabilizing, which could influence Fed rate-cut timing and impact gold’s safe-haven demand.
- US Non-Farm Payrolls — 2026-09-04: Strong job data might reinforce a hawkish Fed stance, lifting real rates and creating headwinds for the non-yielding asset.
- US Producer Price Index — 2026-09-10: A hotter PPI reading could signal persistent inflationary pressure, potentially delaying Federal Reserve easing and weighing on gold prices.
- US Consumer Price Index — 2026-09-11: As the headline inflation metric, this data point is critical for gauging real rate expectations and determining if the opportunity cost of holding gold will rise or fall.
Trading Idea
Given the strong uptrend with price holding above all major moving averages and a positive MACD histogram, traders should consider entering long positions in XAU/USD within the entry zone of $4,590 to $4,680. A stop loss would be placed at $4,525 to protect capital if gold breaks below the immediate support level near the 200-day moving average at $4,507.0. The primary target is set at $4,750, which represents a move toward the next psychological resistance and offers a favorable risk-reward ratio based on recent volatility. US investors can implement this strategy by purchasing shares of SPDR Gold Shares (GLD) or iShares Gold Trust (IAU) on major US exchanges, trading COMEX gold futures, or acquiring physical bullion from reputable dealers like APMEX or the US Mint.
Price Outlook and FAQ
Gold is expected to trade between $4,490 and $4,760 tomorrow, with a strong weekly bias toward higher prices as the metal continues its powerful advance. The US gold market remains driven by robust momentum, though investors should watch for any sudden shifts in the dollar index or real yields that could alter this trajectory.
Is gold a good inflation hedge for US investors right now given the current 3.54% CPI and 2.35% real TIPS yield? While gold has historically served as an inflation hedge, its effectiveness is currently tempered by positive real interest rates of 2.35%, which increase the opportunity cost of holding this non-yielding asset. With US annual inflation at 3.54%, the spread between consumer prices and real yields remains relatively tight, limiting the urgency for pure hedging compared to periods of negative real rates.
How do Federal Reserve rate decisions and the 10Y TIPS yield impact gold prices? The Federal Reserve's stance on interest rates directly dictates the opportunity cost for holding gold; when real rates rise, gold becomes less attractive, but a dovish shift or falling real yields can spark significant rallies. Investors should monitor the Fed Funds Rate at 3.63% alongside the 10Y Real Rate (TIPS) of 2.35%, as any decline in these figures would likely provide a bullish tailwind for XAU/USD.
How can US investors buy gold through exchanges or physical dealers? US investors can gain exposure via exchange-traded funds like SPDR Gold Shares (GLD) and iShares Gold Trust (IAU) listed on the NYSE, which offer liquidity and fractional ownership. For physical ownership, reputable sources include APMEX, JM Bullion, and The US Mint, allowing for direct purchase of coins and bars for tangible asset storage.
This article is for informational purposes only and does not constitute investment advice or a financial recommendation. Investing in financial assets involves risk.
Key Takeaways for Traders
-
Current Market Stance: The XAU/USD market remains firmly Bullish, aligning with the technical structure where price holds above all major moving averages and speculative positioning is net long; traders should look to add positions on pullbacks but maintain strict stops below recent support levels.
-
Key Technical Level: Watch the 60-day high at $4,624.1 closely this week, as it acts as immediate overhead resistance that must be cleared for a breakout toward the next psychological milestone, while the SMA 200 at $4,507.0 serves as the nearest dynamic support.
-
Macro Driver: Monitor the 10Y Real Rate (TIPS) at 2.35% alongside the Fed's forward guidance to determine if rising yields continue to suppress non-yielding gold or if a dovish pivot in rate expectations provides further tailwinds for the precious metal.
-
Flow Signal: Strong ETF inflows of $2.97 billion and a significant increase in non-commercial net long contracts by 38,279 over the past week indicate robust institutional demand that is offsetting short-term volatility and supporting higher prices.
-
Risk Consideration: The primary risk to the gold thesis involves a sudden strengthening of the US Dollar Index (DXY) or a spike in inflation data that forces the Fed to hold rates higher, which would increase the opportunity cost for holding gold and trigger profit-taking near current resistance.
