Market Bias
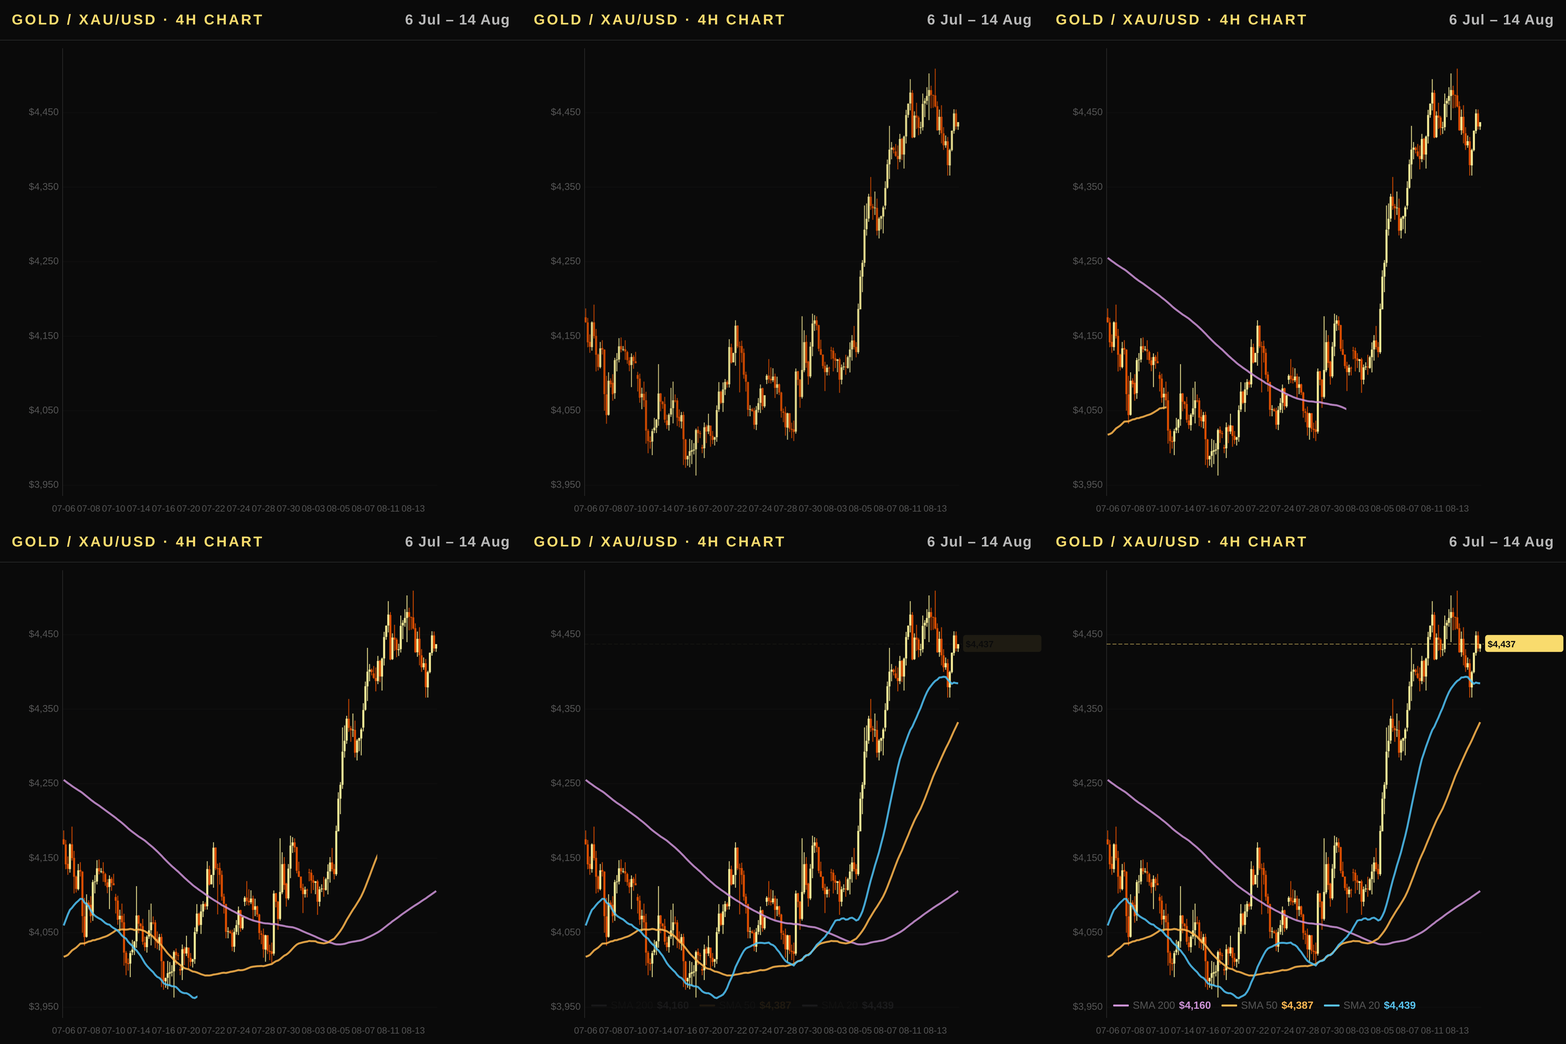
Bullish as price trades above both the 20-day and 50-day moving averages, while still below the 200-day average — a recovery phase inside a longer-term downtrend, supported by weekly gains of 2.23%. The RSI reading of 67.7 confirms momentum on the strong side of the neutral 50 line, and the 50-day at $4,150.1 now sits well beneath spot as support rather than overhead resistance.
Executive Summary
The US gold price today stands at $4,437.3 per ounce, reflecting a strong 1-week gain of 2.23% and an impressive year-over-year rally that has lifted the asset by over 32%. Despite recent strength in real interest rates which act as a bearish headwind for this non-yielding asset, robust inflows into US gold ETFs have provided critical support to prices amid geopolitical uncertainty. This bullish sentiment persists even as the broader market grapples with sticky inflation data and a resilient Federal Reserve stance that keeps borrowing costs elevated. For investors tracking the gold price today in the US, current technical momentum suggests continued upside potential, though caution is warranted near key resistance levels where dollar strength could once again weigh on demand for bullion.
US Outlook: Fed Policy, Real Rates, and Gold's Safe-Haven Premium
- Fed policy trajectory: The Federal Reserve maintains its current funds rate at 3.63%, with recent market commentary suggesting a potential shift toward cuts later in the year if inflation cools further. This dovish stance reduces pressure on gold by lowering the opportunity cost of holding non-yielding assets, supporting the bullish momentum seen recently despite technical corrections.
- Real rates and gold: The 10Y Real Rate (TIPS) sits at 2.39%, having eased by 0.03 percentage points over the past month. Falling real rates act as a tailwind for XAU/USD by diminishing the yield advantage of bonds, making physical and paper bullion more attractive to US investors seeking preservation against currency devaluation risks.
- Dollar impact: The US Dollar Index (DXY) is currently trading at 99.67 with a weekly change of +0.07% but showing monthly weakness of -1.05%. A softer dollar lowers the effective price for foreign buyers, which typically boosts global demand and lifts spot prices in USD terms; conversely, any renewed strength would suppress this external flow component.
- Federal Reserve forward guidance: The most recent FOMC minutes have emphasized data-dependence rather than immediate rate cuts, introducing a slight pause that tempers short-term gold rallies until clearer economic signals emerge regarding employment and inflation dynamics in the coming quarters.
- US inflation context: Annual CPI remains elevated at 3.54%, well above the Fed’s 2% target but showing signs of moderation compared to peak levels. While high inflation usually hurts real purchasing power, sticky prices can also justify central bank tightening, which would be negative for gold unless offset by a sharp decline in nominal yields or geopolitical shocks driving safe-haven flows.
Technical Analysis
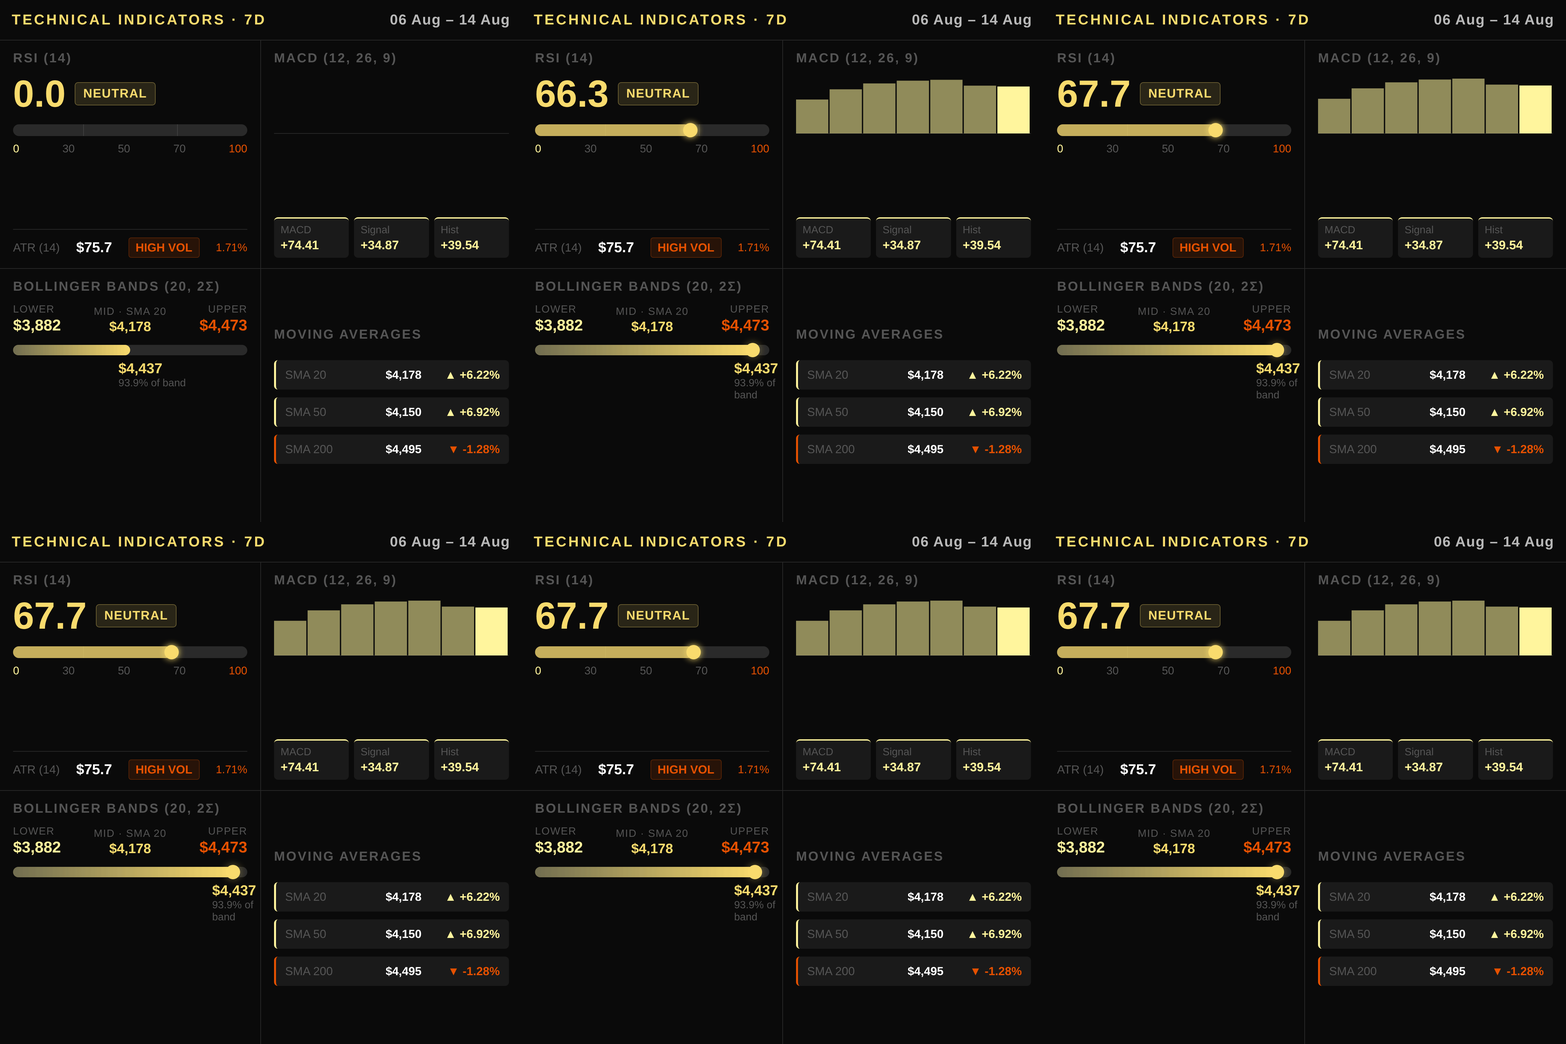
Gold in USD is currently trading at $4,437.30, recovering inside a longer-term downtrend against its primary moving averages while showing resilience near key technical zones. Price sits below the 200-day Simple Moving Average (SMA) of $4,494.7, which remains active overhead resistance, while holding well above the support cluster formed by the SMA 50 at $4,150.1 and the SMA 20 at $4,177.5. The Relative Strength Index (RSI) sits at 67.7, indicating strong bullish momentum that has not yet reached overbought territory but suggests a potential pause or pullback before any further recovery toward the all-time high range. Momentum is supported by a positive MACD histogram value of 39.54, signaling that buyers retain control on the shorter timeframes even as the 200-day average still caps the longer-term trend. The asset trades inside Bollinger Bands with the middle band at $4,177.5 and the upper band near current levels around $4,473.3, suggesting volatility is expanding from recent lows but has not yet broken out decisively above the 60-day resistance level of $4,591.8. The Average True Range (ATR) stands at 75.7, reflecting moderate price swings typical for precious metals during periods of macroeconomic uncertainty and shifting central bank expectations.
Macroeconomic Factors
The US gold market is currently navigating a complex macroeconomic landscape shaped by divergent signals from inflation, central bank policy, and currency dynamics. The Federal Reserve maintains its funds rate at 3.63%, while the 10-year Treasury yield has risen to 4.6% this week; however, the critical metric for gold remains the real interest rate measured via TIPS, which sits at 2.39%. A slight decline in real yields over recent weeks eases the opportunity cost of holding non-yielding assets like XAU/USD, providing a modest bullish tailwind despite persistent inflation concerns. The US Consumer Price Index annualized to 3.54%, indicating that price pressures are moderately elevated but not accelerating rapidly enough to force aggressive rate hikes or trigger stagflation fears at this stage.
The US Dollar Index (DXY) has weakened marginally over the month, dropping 1.05% and trading near 99.67 today. This softening dollar reduces the effective price of gold for international buyers across emerging markets and Europe, supporting global demand even as domestic real rates remain positive. A weaker DXY aligns with broader risk sentiment in a market where geopolitical tensions—particularly around Middle East conflict—have heightened safe-haven flows into traditional stores of value like bullion. Copper futures have rallied 5.03% over the month to $6.613/lb, reflecting supply constraints and industrial demand from infrastructure spending; this divergence suggests that commodity prices are decoupling slightly as inflationary pressures persist in energy-intensive sectors while gold benefits from monetary easing expectations. The yield curve remains upward-sloping with a 0.51% spread between the 10Y and 2Y Treasury, signaling no imminent recession risk but also limiting aggressive bull market momentum for equities relative to precious metals as investors reassess inflation persistence.
Positioning and Market Flows
CFTC Commitment of Traders data reveals a robust bullish speculative stance in US gold futures, with non-commercial net positioning at 217,940 contracts following a significant week-over-week increase of 31,258 contracts. This accumulation reflects growing hedge fund appetite for the yellow metal as safe-haven demand intensifies against geopolitical volatility and persistent inflation concerns driving institutional rebalancing toward precious metals allocations in US portfolios.
Institutional flows through exchange-traded funds remain supportive despite broader market uncertainty, with monthly net inflows totaling approximately $2.97 billion bringing total holdings to 4,068 tonnes for the period ending July 1st. These substantial positive flows indicate that long-term capital continues to rotate into physical-backed securities as a hedge against currency debasement and fiscal expansion risks facing US policymakers over the coming quarters.
Central bank demand persists as a structural tailwind underpinning gold prices, though current data focuses primarily on speculative positioning rather than official sector purchases which have been more muted recently. The combination of rising ETF inflows and aggressive non-commercial buying suggests that market sentiment remains firmly aligned with higher price targets despite short-term technical corrections near key resistance zones above $4,500 per ounce in the US gold market.
Correlated Assets
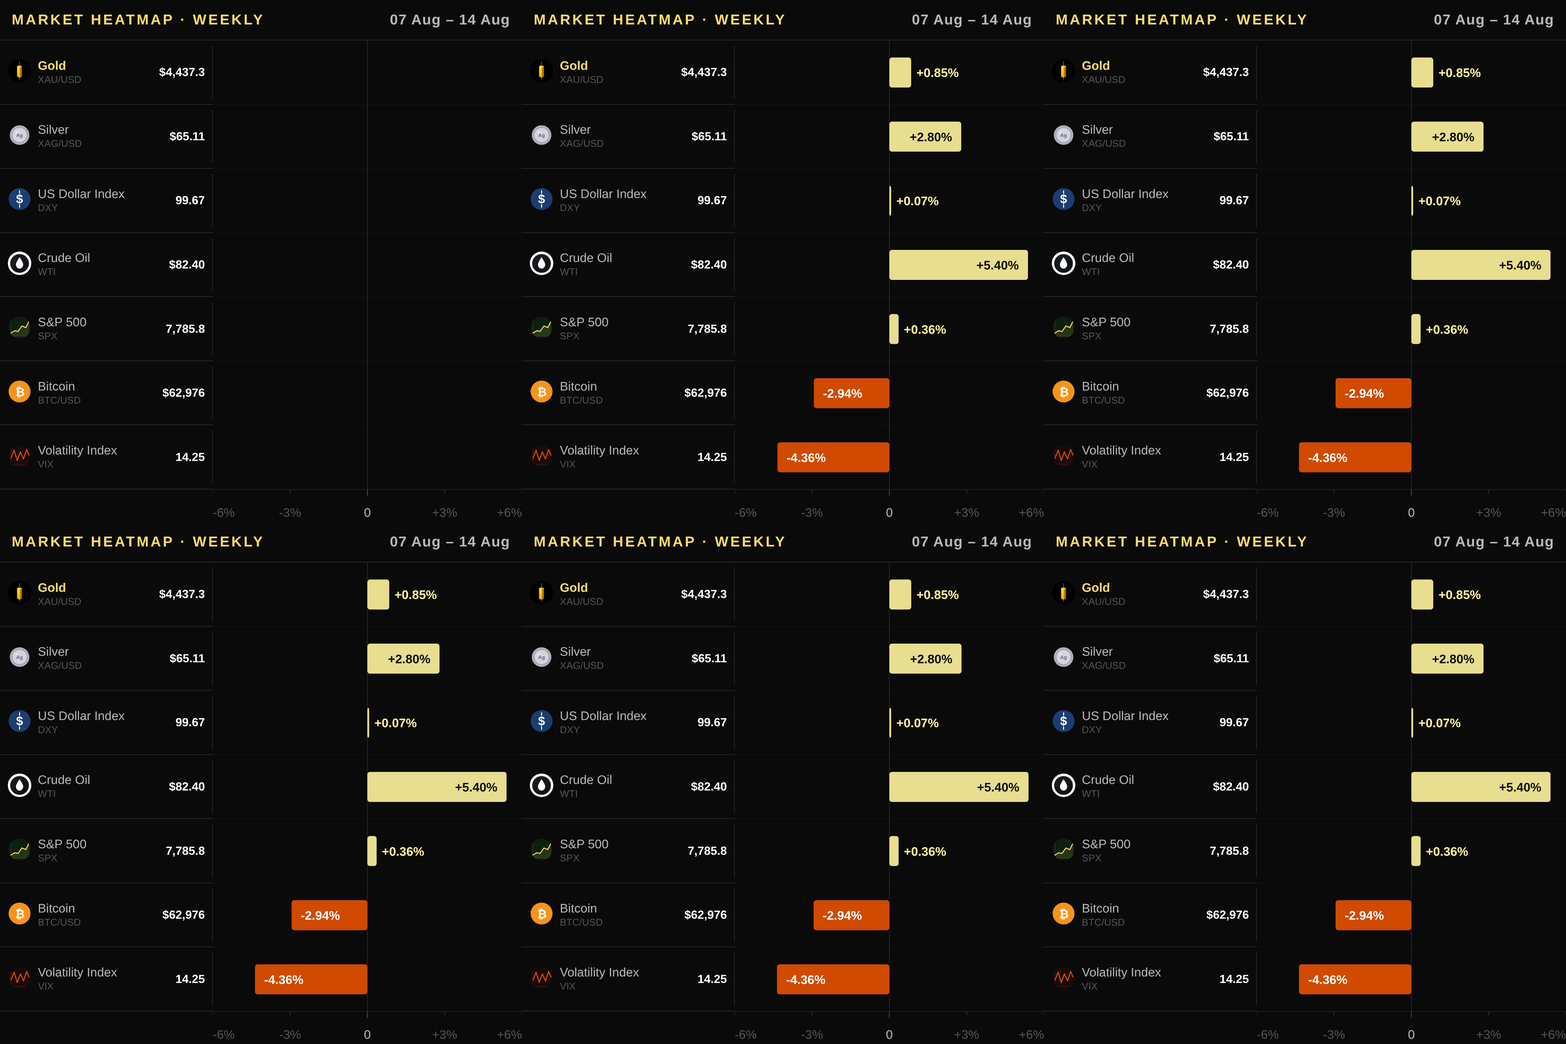
Gold’s inverse relationship with the US Dollar Index (DXY) remains intact as the greenback steadies near 99.67, a level that has declined marginally over the month and supports higher gold prices for global buyers. The yield on the US10Y bond at 4.6% rose slightly this week, reinforcing real rates that cap bullish momentum even as central banks monitor inflation cooling to 3.54%. Silver outperformed its peer group with a weekly gain of 2.8%, while copper advanced by 0.65% alongside WTI oil’s strong performance up 5.4%, creating a backdrop where industrial demand and energy costs align positively for precious metals. The S&P SPX index holds steady at roughly 7,786 with minimal volatility, keeping equity risk premium low relative to the safe-haven appeal of bullion. Conversely, Bitcoin retreated slightly weekly despite headlines suggesting it acts as an oasis during geopolitical shocks, a divergence that underscores gold’s superior resilience in traditional crisis scenarios. The VIX fear gauge dropped by over 4% on the week, indicating reduced panic but failing to erase technical selling pressure as price lingers below its key resistance zone near $4591.
Upcoming Catalysts
- US Gross Domestic Product — 2026-08-26: A revision to quarterly growth figures could alter market expectations for Federal Reserve policy, influencing gold as a real-rate proxy.
- US Non-Farm Payrolls — 2026-09-04: Stronger-than-expected job creation data may push the Fed toward higher rates or slower cuts, creating headwinds for non-yielding assets like XAU/USD.
- US Producer Price Index — 2026-09-10: Changes in wholesale inflation readings can signal future consumer price pressures and impact expectations regarding real interest rates and monetary easing.
- US Consumer Price Index — 2026-09-11: The annualized CPI report is a primary gauge of US inflation; rising figures often tighten Fed policy outlooks, while cooling data supports the case for lower yields benefiting gold prices.
Trading Idea
A long position in XAU/USD is warranted as price trades above both the 20-day and 50-day moving averages with a positive MACD histogram. Investors should look to enter on pullbacks toward $4,350–$4,420, using the SMA 20 at $4177.5 and current spot levels of approximately $4437 as reference points for execution logic. A stop loss is placed below $4,150, immediately beneath that average, which allows for normal ATR swings of roughly 75 points while invalidating the setup if that support gives way. The primary target sits at $4,590, the 60-day high, with the SMA 200 at $4,494.7 as the intermediate hurdle that must be cleared on the way. US investors can implement this view through SPDR Gold Shares (GLD), iShares Gold Trust (IAU) or SPDR Gold MiniShares (GLDM) on US exchanges, or by buying COMEX gold futures for leveraged exposure.
Price Outlook and FAQ
Gold prices are expected to trade between USD $4350 and USD $4520 tomorrow as traders digest recent momentum near key resistance, while maintaining a bullish bias for the week given strong ETF inflows of approximately $2.97 billion.
Is gold still an effective inflation hedge for US investors when CPI is running at 3.54%? Yes, but with nuance; real interest rates (TIPS) currently sit at 2.39%, which lowers the opportunity cost compared to a higher yield environment and supports non-yielding assets against persistent price increases.
How do Federal Reserve rate decisions and TIPS yields influence gold prices specifically? When the Fed keeps funds rates steady or cuts expectations rise, real TIPS yields fall—reducing the drag on holding physical metal—and this dynamic currently favors a higher bias for XAU/USD despite nominal yield strength at 4.6%.
What are the primary instruments available to US investors seeking exposure today? Investors can access liquid markets via SPDR Gold Shares (GLD) and iShares Gold Trust (IAU) on the NYSE, purchase physical coins or bars through accredited dealers like APMEX or JM Bullion, buy directly from the US Mint, or trade COMEX gold futures for leveraged exposure.
This article is for informational purposes only and does not constitute investment advice or a financial recommendation. Investing in financial assets involves risk.
Key Takeaways for Traders
- Current Market Stance: XAU/USD is trading bullish with a confirmed crossover as price sits above both moving averages; traders should consider long entries near current support levels while monitoring for any rejection at resistance zones that could signal a trend reversal.
- Technical Level to Watch: The 60-day high of $4,591.8 acts as immediate overhead resistance this week, and the RSI at 67.7 — firmly above neutral but not yet overbought — suggests caution against chasing higher prices without confirmation from price action near key pivots like SMA 20 at $4,177.5 or the upper Bollinger Band limit around $4,473.
- Macro Driver to Monitor: Watch for shifts in real interest rates driven by TIPS yields and Fed policy signals; declining real rates would support gold’s rally while rising ones could dampen momentum as opportunity costs increase for non-yielding assets like bullion holdings.
- Key Flow Signal: Strong ETF inflows totaling nearly $3 billion this month indicate sustained institutional demand, reinforcing bullish positioning despite mixed COT futures data where speculative net longs have increased significantly over recent weeks but commercial hedging remains short-term negative.
- Risk Consideration: Geopolitical risks and oil price volatility could fuel safe-haven flows temporarily; however, an unexpected rise in US CPI or stronger-than-expected Non-Farm Payrolls next week might tighten monetary policy expectations and trigger a corrective pullback toward lower moving averages if real rates climb unexpectedly fast.
