Market Bias
Bullish. The daily chart shows a strong uptrend with price holding above the 20-, 50- and 200-day moving averages, and gold is testing its 60-day high resistance at USD 4,624.1 with a positive MACD histogram behind it. Momentum is intact, though the approach to overhead resistance argues for disciplined entries ahead of major US economic data releases later this month. Canadian investors should note that the CAD has strengthened slightly over the past 30 days, which dampens the local price of gold despite the global rally.
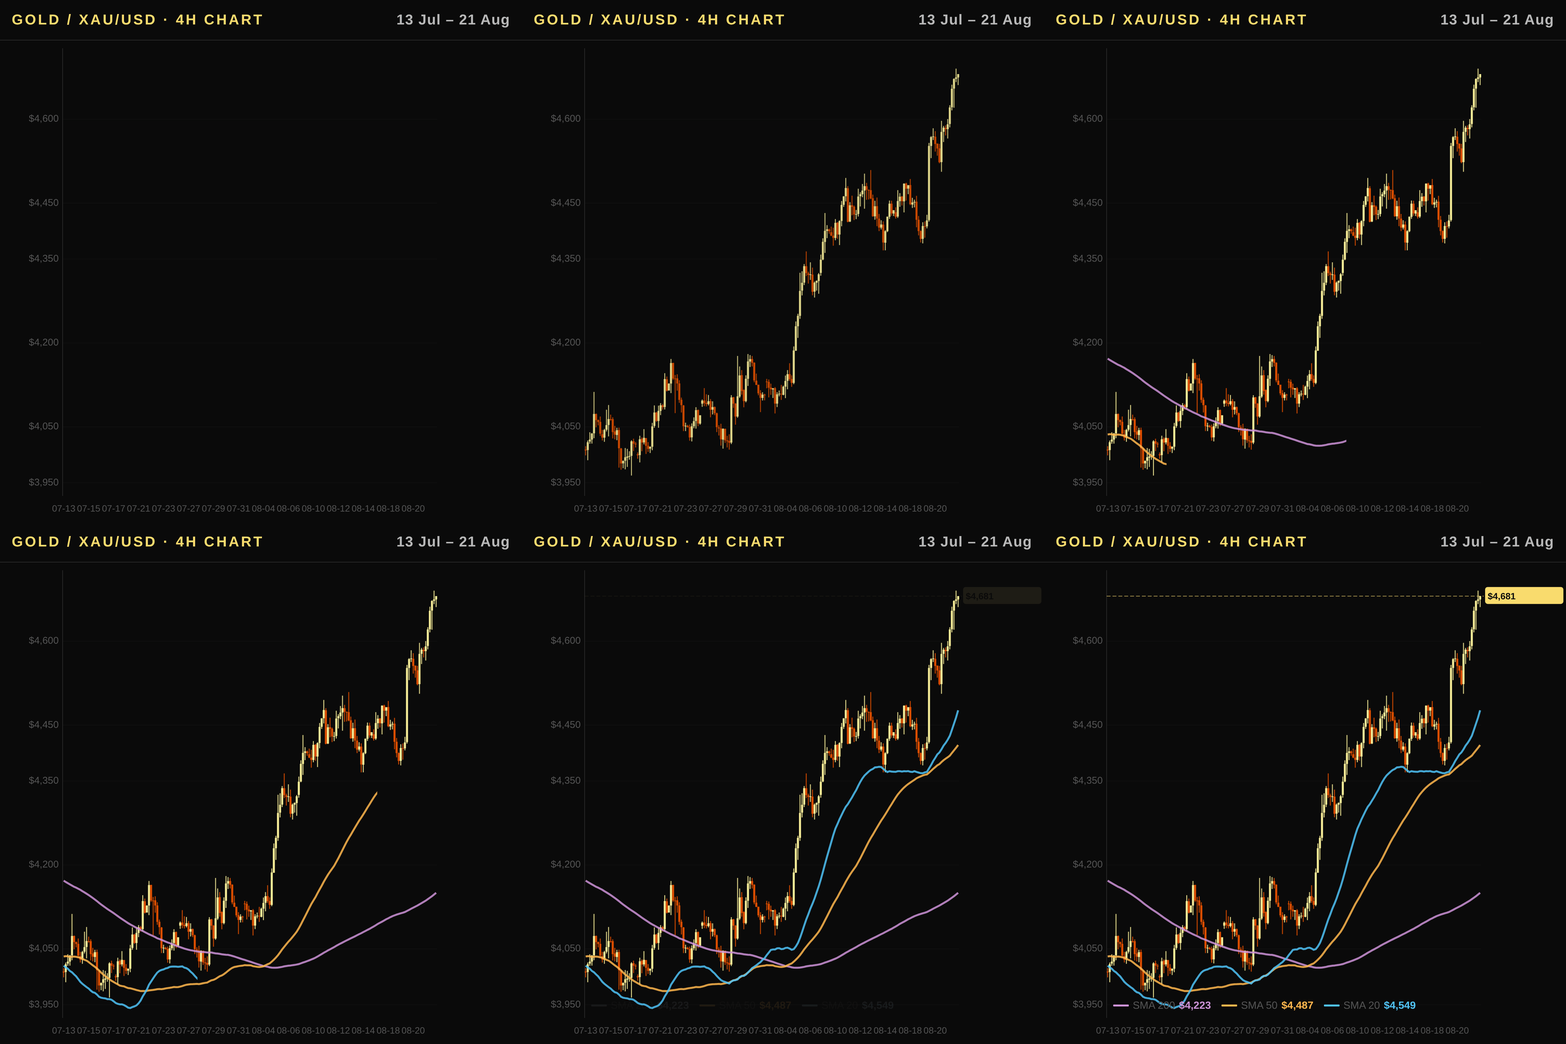
Executive Summary
The gold price today in Canada stands at 6,366 CAD per ounce, reflecting a robust global rally where XAU/USD has surged 5.56% over the past week. Driven by a strengthening safe-haven narrative and central bank demand, the asset continues its structural uptrend despite rising real rates of 2.35% as measured by TIPS yields. Investors seeking to hedge against inflation in a high-rate environment view gold as an increasingly attractive non-yielding asset, with ETF flows showing a net monthly inflow of approximately $2.97 billion. This gold analysis highlights how Canadian holders benefit from currency dynamics, particularly as the loonie strengthens versus the dollar, though global risk premiums and geopolitical tensions remain the primary catalysts for this bullish momentum in the gold market.
Canada Outlook: BoC Policy, the Loonie, and Gold in CAD
- Gold Pricing Dynamics: Canadian investors purchase gold priced in CAD; consequently, a strengthening loonie reduces the local cost of bullion, while a weakening loonie pushes the CAD price higher. Currently, the loonie is strengthening with a 30-day change of -2.12% against the US dollar, which translates to a downward pressure on the domestic gold price despite global strength.
- Loonie as a Commodity Currency: The Canadian dollar acts as a commodity currency closely correlated with energy and metals prices, creating a unique feedback loop between global risk sentiment and local purchasing power. This linkage means that shifts in WTI oil prices directly influence the loonie's trajectory and, by extension, the CAD-denominated gold price for domestic savers.
- Bank of Canada Policy Context: The Bank of Canada maintains a policy rate of 2.25%, focusing independently on its 2% inflation target while navigating the global interest rate environment set by the US Federal Reserve. Although the BoC and Fed operate under different mandates, the resulting rate differential remains a primary driver for USD/CAD exchange rate volatility that impacts gold affordability in Canada.
- Inflation and Economic Growth: Domestic economic conditions are characterized by an annual CPI of 2.1% and GDP growth of 1.7%, providing a stable backdrop for local asset valuation. These figures indicate that the domestic economy is managing inflationary pressures effectively, which supports steady demand for gold as a hedge without triggering restrictive monetary tightening that would severely damage the currency.
Technical Analysis
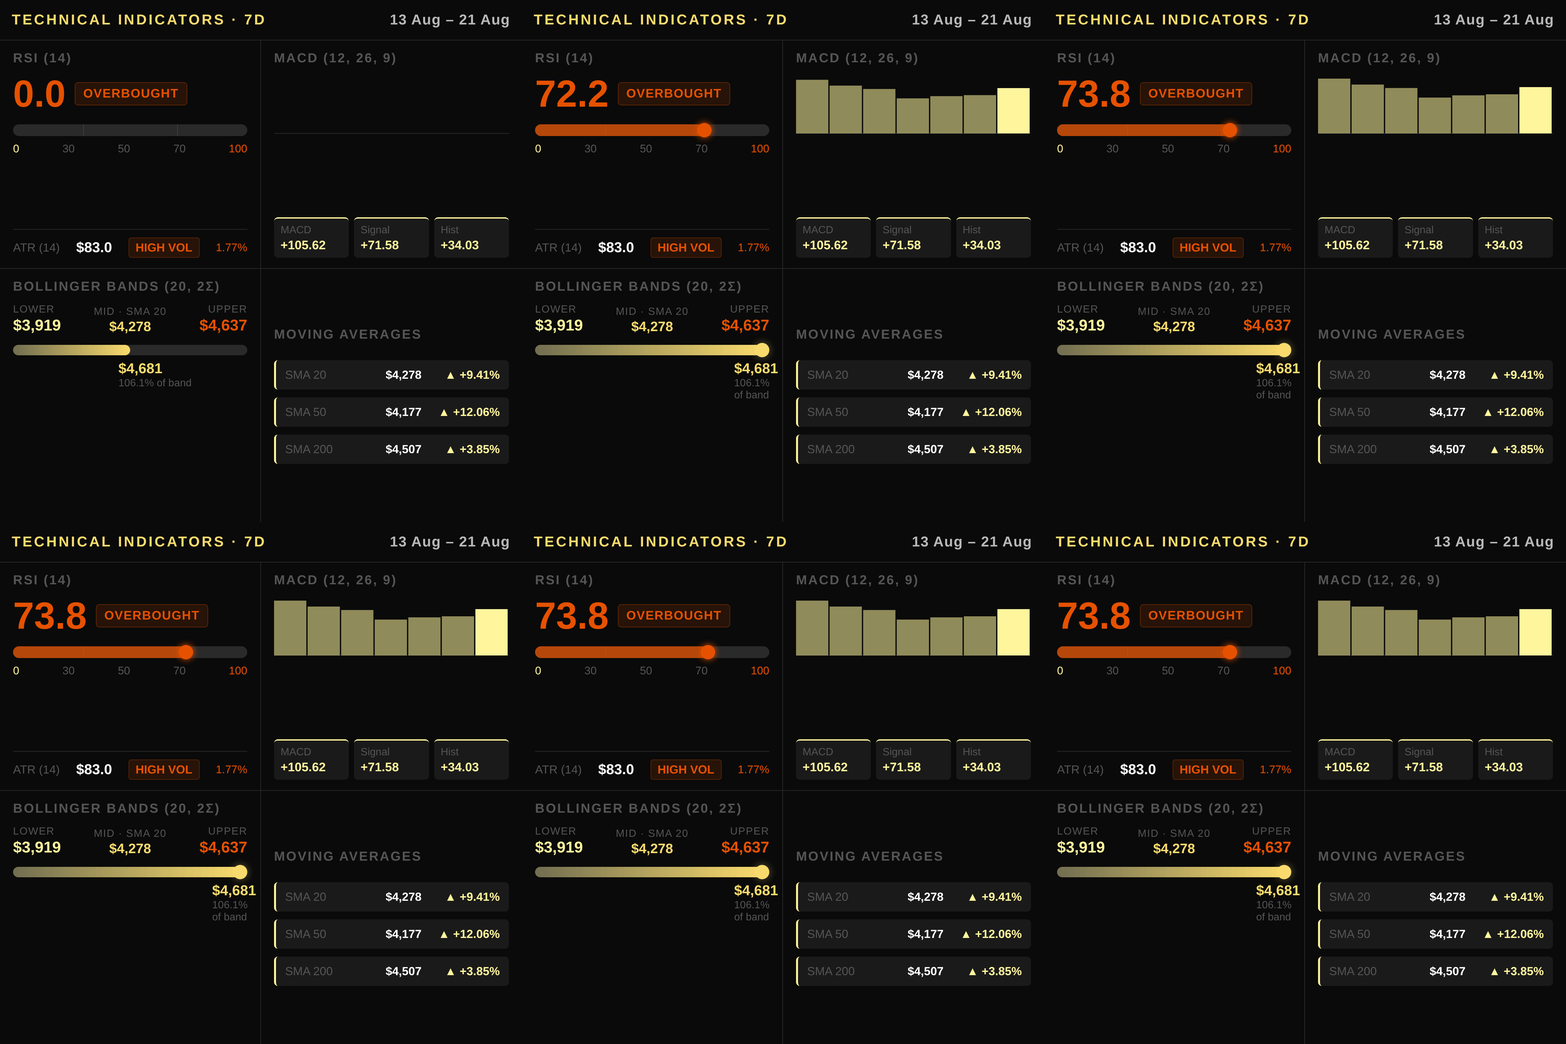
Gold is trading at $4624.1, holding just below the $4637.0 upper Bollinger Band while sitting above the $4507.0 200-day moving average. The current price sits comfortably above the $4278.2 SMA 20 and $4177.0 SMA 50, confirming a strong short-term uptrend despite approaching overbought territory.
The RSI stands at 73.8, well above the neutral level of 50 but not yet in deep overbought territory, suggesting room for further upside before a corrective pullback becomes likely. MACD shows bullish momentum with a line at 105.62 rising above its signal line at 71.59, supported by a positive histogram of 34.03.
Volatility remains elevated with an ATR reading of 83.0, indicating sharp daily moves that should inform position sizing. Key resistance sits at the 60-day high of $4624.1 and the upper Bollinger Band at $4637.0. Immediate support lies at the SMA 20 of $4278.2, with stronger backing from the SMA 50 at $4177.0 and the lower Bollinger Band at $3919.3.
For Canadian investors, these USD levels convert directly to CAD using the current exchange rate: resistance near CAD 6,366/oz, the SMA 200 support at CAD 6,206/oz, and the SMA 20 further down at CAD 5,890/oz.
Macroeconomic Factors
The US Federal Reserve maintains a funds rate of 3.63%, with the broader macroeconomic environment defined by a normal, positively sloped yield curve where the 10Y Treasury yield stands at 4.6% and the 2Y yield is lower at 4.22%. Real rates remain restrictive for gold as the 10Y Real Rate (TIPS) sits at 2.35%, imposing a significant opportunity cost on this non-yielding asset. The US Dollar Index (DXY) has weakened over the past month by 2.59%, offering a supportive tailwind that makes gold cheaper for international buyers and dampens selling pressure from dollar strength. Geopolitical tensions continue to drive risk-off flows, reinforcing safe-haven demand even as higher yields theoretically compete with bullion. This macro backdrop creates a complex dynamic where restrictive real rates act as a headwind, but the weakening dollar and persistent geopolitical instability provide a powerful counterbalance that sustains gold’s appeal for global investors.
Positioning and Market Flows
The CFTC’s latest COT report shows non-commercial traders holding a net long position of 222,189 contracts in gold futures, reflecting strong speculative bullish sentiment supported by rising risk appetite and geopolitical tensions. Commercial hedgers maintain a substantial short net position of -258,418 contracts, which is purely protective inventory management for producers and does not signal broader market weakness.
Institutional ETF flows remain robustly positive, with the sector adding approximately 23.5 tonnes of gold in July, equivalent to roughly $2.97 billion in inflows. This sustained accumulation underscores a long-term strategic allocation by funds seeking portfolio diversification away from equities and bonds, even as short-term price volatility persists.
Central bank demand continues to provide a structural floor for prices, with emerging market authorities aggressively expanding reserves amid currency devaluation fears and sanctions risk. While ETF flows track monthly sentiment, central bank buying acts as a steady, non-speculative undercurrent that supports the broader bull thesis independent of retail positioning.
Correlated Assets
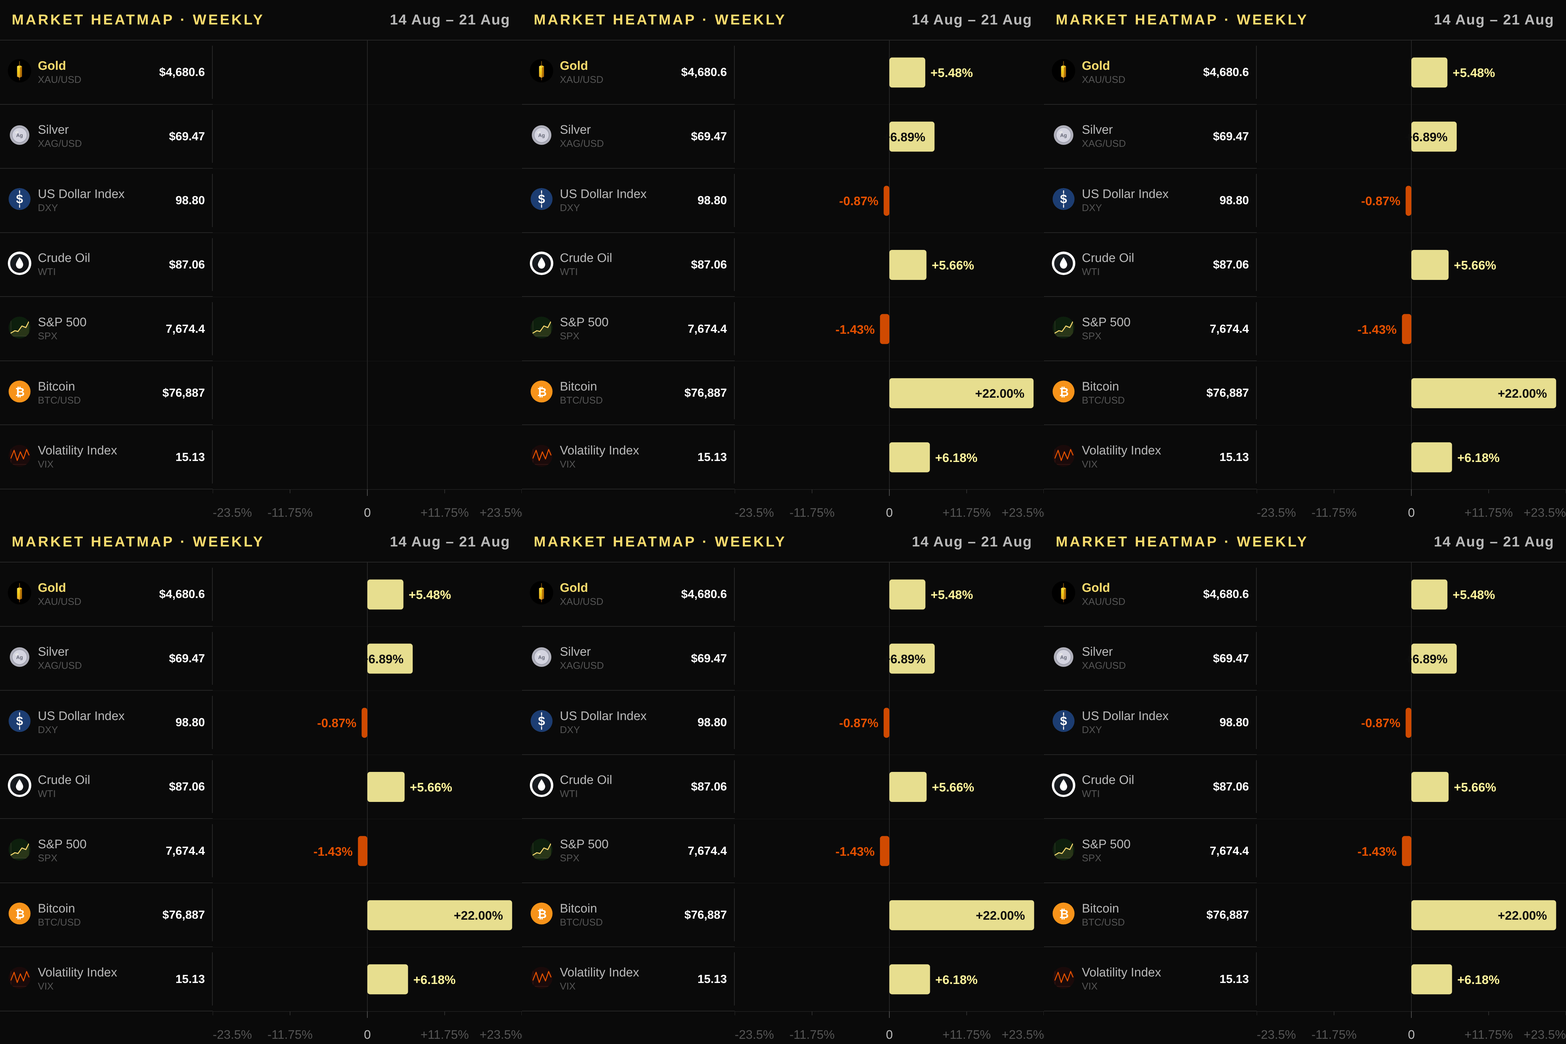
Gold’s relationship with key assets clarifies the broader market backdrop. The US Dollar Index (DXY) at 98.8 has fallen -0.87% this week and -2.59% this month, providing a significant tailwind for XAU/USD as lower dollar strength reduces the cost of gold for foreign buyers. Copper is trading at USD 6.5795/lb with a modest weekly decline of -0.3% but a solid monthly gain of +4.35%, reflecting its role as an industrial demand barometer that often precedes broader economic shifts. Silver stands out with a robust rally, advancing +6.89% weekly and +20.19% monthly to USD 69.466/oz, reinforcing the precious metals complex’s momentum against traditional safe havens. WTI crude oil is priced at USD 87.06/barrel, up +5.66% this week despite a -5.56% monthly pullback; as an energy asset, higher oil prices generally support the commodity-linked loonie and provide geopolitical risk premiums that benefit gold’s safe-haven status. The S&P 500 (SPX) sits at 7674.3701 with a weekly drop of -1.43% but a monthly gain of +3.59%, indicating equity market volatility that often drives investors toward non-correlated assets like gold during risk-off episodes. The US 10Y yield remains elevated at 4.738%, up 0.89% this week, which typically exerts some pressure on gold but is currently outweighed by the dollar’s decline and geopolitical tensions. The VIX fear gauge has surged +6.18% weekly to 15.13, signaling renewed market stress that supports gold’s defensive appeal despite its non-yielding nature. Finally, Bitcoin at USD 76,887.1406 posted an impressive +19.19% weekly gain and +22.5% monthly advance, though its high volatility makes it a distinct asset class rather than a direct substitute for gold’s stability in portfolios.
Upcoming Catalysts
- US Gross Domestic Product — 2026-08-26: Key reading for growth momentum and potential Fed pivot timing that directly influences real rates and gold demand.
- US Non-Farm Payrolls — 2026-09-04: Labor market strength will shape inflation expectations and the probability of rate cuts, a primary driver for XAU/USD volatility.
- US Producer Price Index — 2026-09-10: Core supply chain costs impact future CPI forecasts, providing critical context for the Federal Reserve's monetary policy stance.
- US Consumer Price Index — 2026-09-11: The headline inflation figure determines the immediate trajectory of Treasury yields and the opportunity cost for holding non-yielding gold assets.
Trading Idea
We maintain a long position on continuation through the 60-day high, with an entry zone between USD 4,590–4,650 (CAD 6,320–6,402). Place a stop loss below USD 4,500 (CAD 6,195), just under the SMA 200 at USD 4,507.0, to protect against a failed breakout. The profit target is USD 4,750 (CAD 6,539), a logical upside extension aligned with the current technical structure. Canadian investors can execute this trade using the iShares Gold Bullion ETF (CGL.TO) or Sprott Physical Gold Trust (PHYS) on the TSX, or by purchasing Royal Canadian Mint gold bars and Maple Leaf coins from authorized dealers.
Price Outlook and FAQ
Gold is expected to trade between USD 4,560–4,720 (CAD 6,283–6,507) tomorrow, maintaining a bullish one-week bias toward USD 4,780 (CAD 6,590) as the metal consolidates its strong monthly gains.
Is gold still an effective inflation hedge for Canadian investors given current CPI and real rates? Yes, although US CPI sits at 3.54%, real yields remain a constraint; however, gold's non-yielding nature offers protection when central banks pivot or if inflation expectations re-emerge, especially with the Bank of Canada's rate differential narrowing. The asset performs best not just against headline inflation but when real interest rates, measured by TIPS, decline to lower opportunity costs for holders.
How do Fed and BoC rate decisions impact gold prices in CAD specifically? Gold in CAD rises when the US Dollar strengthens relative to the Loonie, which typically occurs if the Bank of Canada cuts rates faster than the Fed; conversely, a stronger loonie suppresses local prices regardless of global demand. The current strengthening loonie exerts downward pressure on the CAD gold price, offsetting some of the bullish momentum seen in USD terms.
What are the best ways for Canadian investors to purchase physical or exchange-traded gold? Canadian investors can access the market through the iShares Gold Bullion ETF (CGL.TO) or Sprott Physical Gold Trust (PHYS) on the TSX, which offer low-cost exposure without storage hassles. For direct ownership, Royal Canadian Mint bars and Maple Leaf coins are readily available from licensed bullion dealers across Canada, providing a tangible store of value for portfolios.
This article is for informational purposes only and does not constitute investment advice or a financial recommendation. Investing in financial assets involves risk.
Key Takeaways for Traders
- Current Market Stance: The XAU/USD market remains in a strong bullish trend as price sits above all major moving averages with a positive MACD histogram, confirming that momentum favors longs despite recent volatility; traders should maintain long positions while respecting the tight Bollinger Band upper boundary of $4637.0.
- Key Technical Level: The 60-day high resistance at USD 4624.1 and CAD 6,366 acts as immediate intraday pivot, where a decisive break above could extend gains toward next week’s psychological targets before a potential pullback to the SMA 20 support of $4278.2.
- Macro Driver: US real rates remain the primary determinant for gold prices today, with the 10Y Real Rate (TIPS) at 2.35% providing a floor that limits downside while the Fed holds steady at 3.63% and the dollar weakens slightly.
- Flow Signal: Strong institutional inflows into gold ETFs totaling $2.97 billion in July alongside a bullish non-commercial net position of 222,189 contracts indicate sustained demand that outweighs short-term profit-taking from commercial hedgers.
- Risk Consideration: Geopolitical tensions and oil price surges support safe-haven flows, but a sudden spike in US CPI or a shift in Fed rhetoric toward hawkishness could rapidly compress gold’s upside given the already elevated RSI of 73.8.
