Market Bias
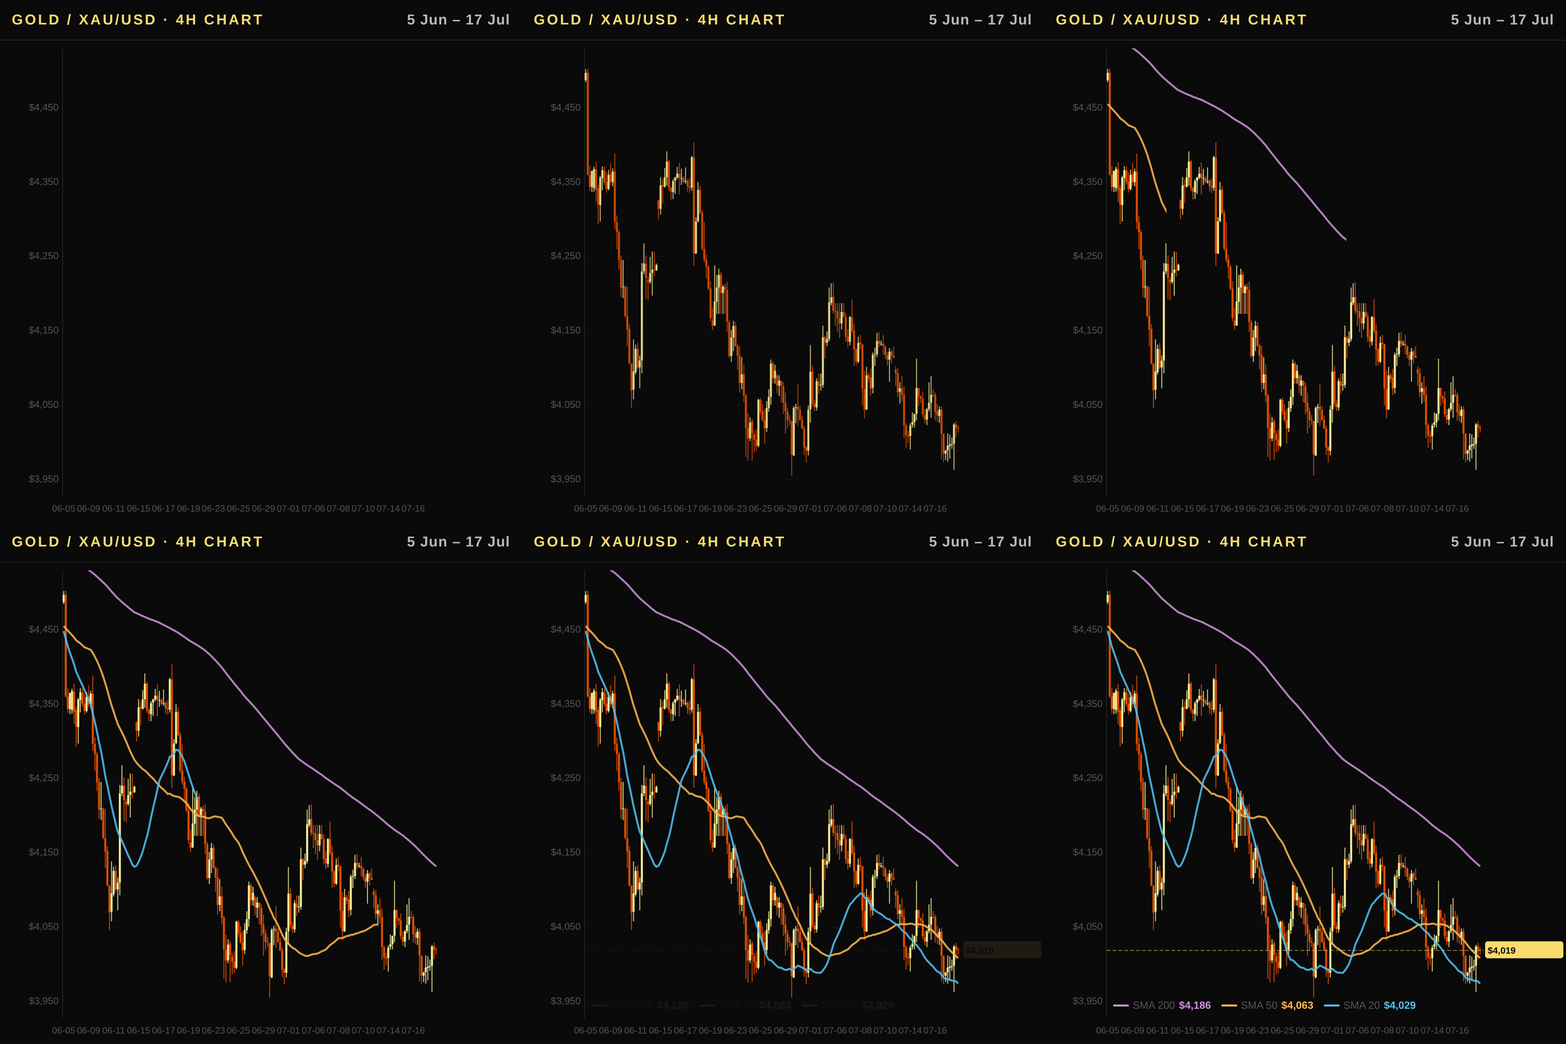
Bearish. Gold is trading below all major moving averages with a confirmed downward trend over the last week, indicating that sellers control momentum despite recent relief rallies near key support zones. The primary technical structure remains intact as price action respects resistance levels established by prior highs and fails to reclaim the 50-day average without external catalysts such as aggressive central bank easing or a sharp geopolitical shock.
Executive Summary
The gold price today in Canada stands at CAD 5,623 per ounce, while the USD equivalent trades near $4013 amid a strong downtrend over the past month. This gold analysis reflects persistent selling pressure as real interest rates rise and technical structures remain bearish below key moving averages. Canadian investors should note that June ETF outflows of approximately CAD 12.9 billion highlight institutional caution, contrasting with continued central bank buying worldwide. Overall, this XAU/USD analysis suggests a bearish bias until price action reclaims the $4076 resistance zone and real yields stabilize near recent lows.
Canada Outlook: BoC Policy, the Loonie, and Gold in CAD
- Canadian investors buying gold see prices quoted directly in CAD; a weaker loonie versus USD lifts the local price while a stronger one pushes it lower, so current movements hinge on exchange-rate dynamics.
- The Bank of Canada maintains its policy rate at 2.25%, targeting inflation near 2% and operating independently from US monetary settings despite cross-border ties influencing capital flows.
- USD/CAD stands steady at 1.4021 this month, meaning every USD ounce trades locally at roughly CAD 5,623 after the FX conversion; any shift in that rate immediately reprices bullion for home investors without waiting for global market moves to catch up.
- As a commodity currency tied closely to energy and metals markets, CAD benefits when WTI oil climbs since crude futures are now trading higher weekly at $82.49, supporting the local dollar against the greenback even as US yields drift upward.
- With Canadian annual inflation holding near 2.1% while GDP growth remains modestly positive at 1.7%, domestic monetary focus stays on price stability rather than aggressive rate cuts, which would weaken the loonie, push USD/CAD higher and lift gold prices in CAD terms.
Technical Analysis
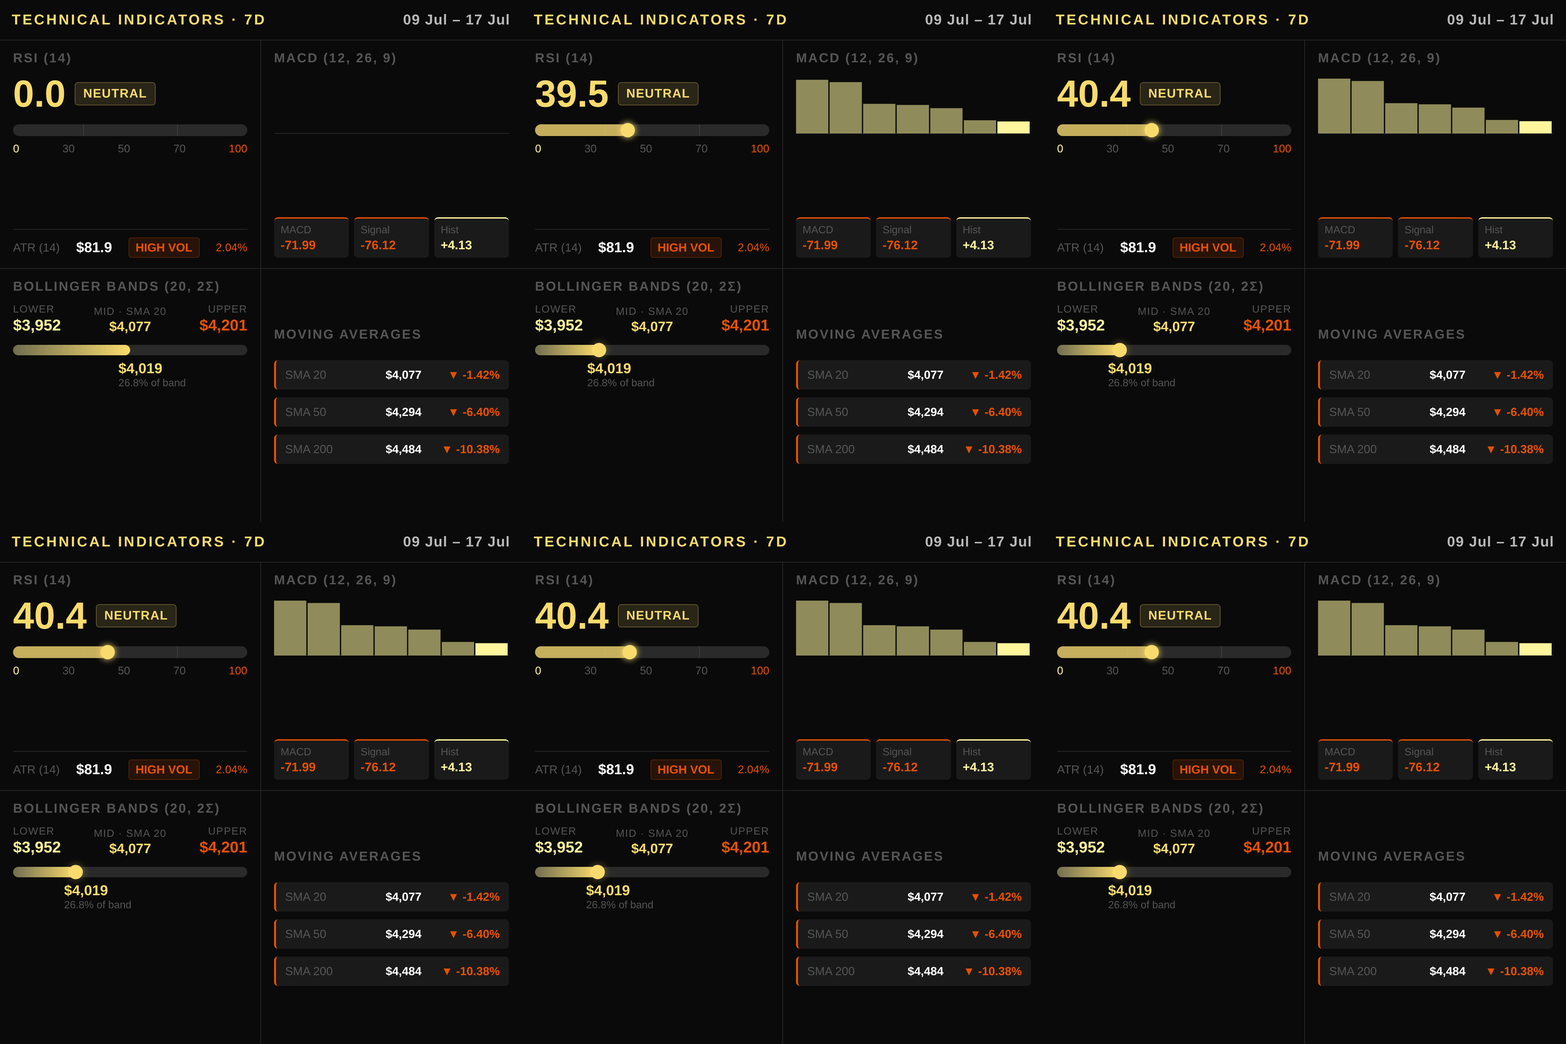
Gold is trading at $4012.7, firmly below all major moving averages, which confirms a strong downtrend structure for XAU/USD. The price sits beneath the 20-day simple moving average (SMA 20: $4076.6), while also falling short of the longer-term SMA 50 at $4293.6 and the critical benchmark SMA 200 at $4484.1. This alignment indicates that bearish momentum is dominant, with each descending moving average acting as overhead resistance for potential bounces.
The Relative Strength Index (RSI) currently reads 40.4, placing gold in neutral-to-bearish territory below the pivotal 50 level but far from oversold conditions near 30. While this suggests room for further downside before a technical rebound becomes likely, it also warns that immediate capitulation is not yet complete. The MACD line remains negative at -71.99, underscoring persistent downward pressure despite a slight uptick in the histogram to +4.13. This positive histogram reading implies easing selling intensity rather than an imminent trend reversal, as buyers have failed to push prices back above key moving averages.
Volatility is moderate with the Average True Range (ATR) at 81.9, meaning daily price swings of roughly $82 are normal for this market regime. Within Bollinger Bands (20-period), gold trades well below the upper band at $4201.1 and near the middle band aligning with the SMA 20, while remaining above the lower support zone at $3952.0.
Key resistance sits first at the SMA 20 near USD $4,076.6 (CAD 5,716), where selling pressure has repeatedly emerged, and only then at the far more distant 60-day high of USD $4,765.2 (CAD 6,681). Immediate support is the 60-day low at USD $3,962.5 (CAD 5,556), backed by the lower Bollinger Band at USD $3,952.0 (CAD 5,541). A sustained break above USD $4,076.6 would invalidate the immediate bearish setup, whereas a decline toward USD $3,900 (approx. CAD 5,468) could trigger stop-loss cascades for leveraged long positions.
Macroeconomic Factors
The US Federal Reserve maintains a policy rate of 3.63%, while real interest rates, reflected by the 10Y Real Rate (TIPS) at 2.35%, have risen steadily over the past year. This increase in real yields elevates the opportunity cost for holding non-yielding assets like gold, exerting a bearish pressure on XAU/USD prices despite safe-haven demand from geopolitical tensions.
The 10Y Treasury yield stands at 4.47%, which remains elevated relative to historical averages but has softened slightly in recent weeks as the market reassesses growth prospects and inflation dynamics. The US Dollar Index (DXY) is currently trading at 100.75, showing a modest weekly decline of -0.22%, yet it remains near multi-month highs that continue to weigh on global gold demand by making bullion more expensive for foreign buyers.
Geopolitical instability in the Middle East has provided a temporary risk-off premium, but this safe-haven bid is increasingly contested by macro headwinds from higher real rates and dollar strength. Canadian investors must recognize that while the Bank of Canada’s policy rate stands independently at 2.25%, its divergence from US monetary conditions still influences capital flows into CAD-denominated gold products such as CGL.TO or PHYS via exchange-traded mechanisms.
Inflation in the United States is running at an annual pace of 3.73%, which remains above the Fed’s 2% target but has moderated enough to allow for cautious rate-cut expectations down the road. For Canadian holders, local inflation sits lower at 2.1% annually, providing a relative purchasing power advantage that can partially offset USD-based downside risks in gold prices when converted back into CAD using the current exchange rate of 1.4021.
Positioning and Market Flows
The CFTC’s latest Commitment of Traders report reveals a net speculative long position of 186,682 contracts in gold futures, indicating that non-commercial traders remain bullish on XAU/USD despite recent price weakness. This accumulation suggests institutional confidence in the metal's upside potential over intermediate horizons.
Conversely, physical and exchange-traded flows tell a different story this month as Gold ETFs recorded significant outflows totaling approximately $9.19 billion USD (roughly CAD 12.9 billion). These net sales by investors signal caution or a rotation away from paper gold holdings toward other assets, acting as immediate headwinds to the spot price even if futures positioning stays intact.
Underpinning these market dynamics is persistent central bank demand for physical gold reserves. While not captured in daily ETF flows or COT data, this structural buying provides a long-term floor that often prevents deep corrections and supports prices during periods of high real interest rates.
Correlated Assets
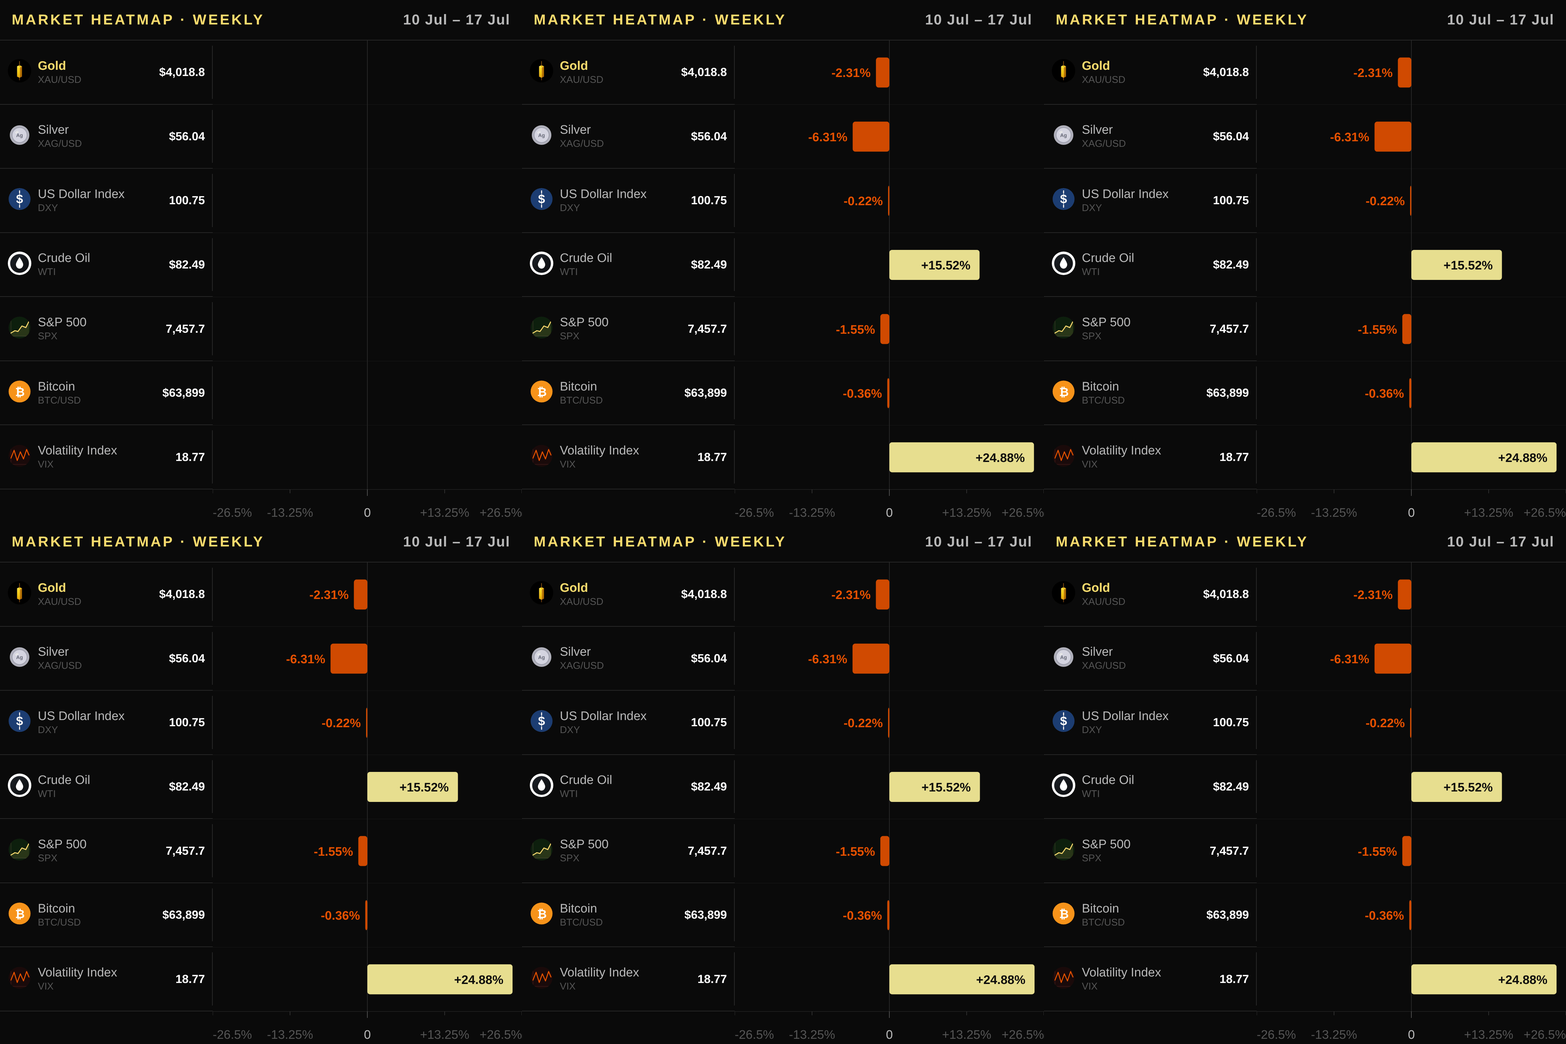
Gold’s correlation with equities is currently negative; the S&P 500 (SPX) sits at 7457.69, down -1.55% weekly and -0.71% monthly, a risk-off backdrop that has yet to outweigh the drag from rising real rates. The US Dollar Index (DXY) trades at 100.75 after falling -0.22% this week but rising +1.22% over the month; its inverse relationship with XAU/USD remains intact as dollar strength pressures non-yielding gold prices globally. Real yields are climbing, reflected in the 10Y Treasury yield of 4.47%, which sits above the TIPS real rate (2.35%), increasing opportunity costs for investors holding physical or paper gold. Silver is underperforming sharply at -6.31% weekly and -15.42% monthly, confirming broad weakness across the precious-metals complex; copper follows a similar downtrend with metal prices sliding -0.22% this week and -2.42% over the month as industrial demand concerns mount alongside weak global growth forecasts. WTI crude oil has surged +15.52% weekly and +7.69% monthly, strengthening CAD via its commodity-linked status while offering a hedge against supply shocks that could lift gold’s safe-haven premium; Bitcoin (BTC) sits at $64098 with a +2.99% weekly gain but does not qualify as a reliable refuge given its high volatility and lack of intrinsic value or central bank backing. The VIX fear gauge has jumped to 18.77, up significantly from recent lows, signaling elevated uncertainty that typically supports gold’s price even when real rates are rising; however, sustained geopolitical stability could eventually reduce this premium if risk assets stabilize without major shocks.
Upcoming Catalysts
- US Gross Domestic Product — 2026-07-30: A key gauge of economic health that could influence Fed policy and risk sentiment for gold.
- US Non-Farm Payrolls — 2026-08-07: Strong job creation data may support the dollar, while weakness could boost safe-haven demand.
- US Consumer Price Index — 2026-08-12: Core inflation readings will shape expectations for future interest rate adjustments and real yields.
- US Producer Price Index — 2026-08-13: Wholesale price trends offer an early look at potential downstream inflation pressures affecting commodity markets.
Trading Idea
A short position in XAU/USD is recommended near $4,020–$4,135 (CAD 5,635–5,798), with a stop loss at $4,185 above the immediate overhead resistance to limit downside risk if price rebounds toward the SMA-20. The primary target is set at $3,850, which aligns with lower Bollinger Band levels and represents value for sellers given the strong downtrend structure currently in place. Canadian investors can execute this thesis through exposure via the iShares Gold Bullion ETF (CGL.TO) or Sprott Physical Gold Trust (PHYS), or by holding physical gold such as Royal Canadian Mint bars and Maple Leaf coins to capture declines in CAD-adjusted terms.
Price Outlook and FAQ
Gold is expected to trade in a USD range of $3905–$4120 tomorrow (CAD 5,476–5,778), maintaining a bearish bias over the next week as price action tests support near $3962.5 ($5,557).
Is gold still an effective inflation hedge for Canadian investors given current CPI data? Yes, but with nuance; while annual US CPI stands at 3.73%, real returns are pressured because the 10Y Real Rate (TIPS) is elevated at 2.35%. For Canadian holders of CAD-priced gold, this creates an opportunity cost that competes against the asset's ability to preserve purchasing power when inflation outpaces bond yields.
How do Bank of Canada and Fed rate decisions impact gold prices in CAD? These decisions drive the USD/CAD exchange rate; if the BoC holds rates at 2.25% while the US keeps policy restrictive, a stronger dollar pushes down local gold prices even if global demand remains steady. A divergence where real yields fall would be bullish for both XAU/USD and the CAD-gold price.
What are the best ways for Canadian investors to access physical or ETF exposure? Investors can utilize liquid options like the iShares Gold Bullion ETF (CGL.TO) on the TSX or the Sprott Physical Gold Trust (PHYS). Alternatively, they may purchase Royal Canadian Mint bars and Maple Leaf coins directly from authorized bullion dealers.
This article is for informational purposes only and does not constitute investment advice or a financial recommendation. Investing in financial assets involves risk.
Key Takeaways for Traders
- Bearish Market Stance: Gold remains firmly below all major moving averages, and although the MACD histogram has turned slightly positive at +4.13 the MACD line at -71.99 keeps downside momentum intact; traders should avoid new long entries until price reclaims key overhead resistance levels and confirms reversal through higher lows.
- Key Technical Level to Watch: The 60-day low support at USD $3,962.5 (CAD $5,557) is the immediate floor where buyers may step in, but a decisive break below this level would trigger algorithmic selling toward the next psychological zone near USD $3,800.
- Main Macro Driver to Monitor: The rising 10Y real rate of 2.35% continues to increase opportunity costs for holding non-yielding gold, reinforcing headwinds while investors weigh weakening global risk sentiment against higher bond yields and a firm US Dollar Index at 100.75.
- Critical Flow Signal: Persistent ETF outflows totaling nearly $9.2 billion this month contradict the bullish COT positioning of speculative traders, highlighting institutional de-risking that outweighs retail or futures-based demand in determining short-term price direction.
- Primary Risk Consideration: Geopolitical volatility acts as a temporary floor for prices but cannot sustain rallies while real rates climb; Canadian investors should consider hedging exposure via physical allocation to Royal Canadian Mint coins if downside momentum accelerates beyond the immediate support zone.
