Market Bias
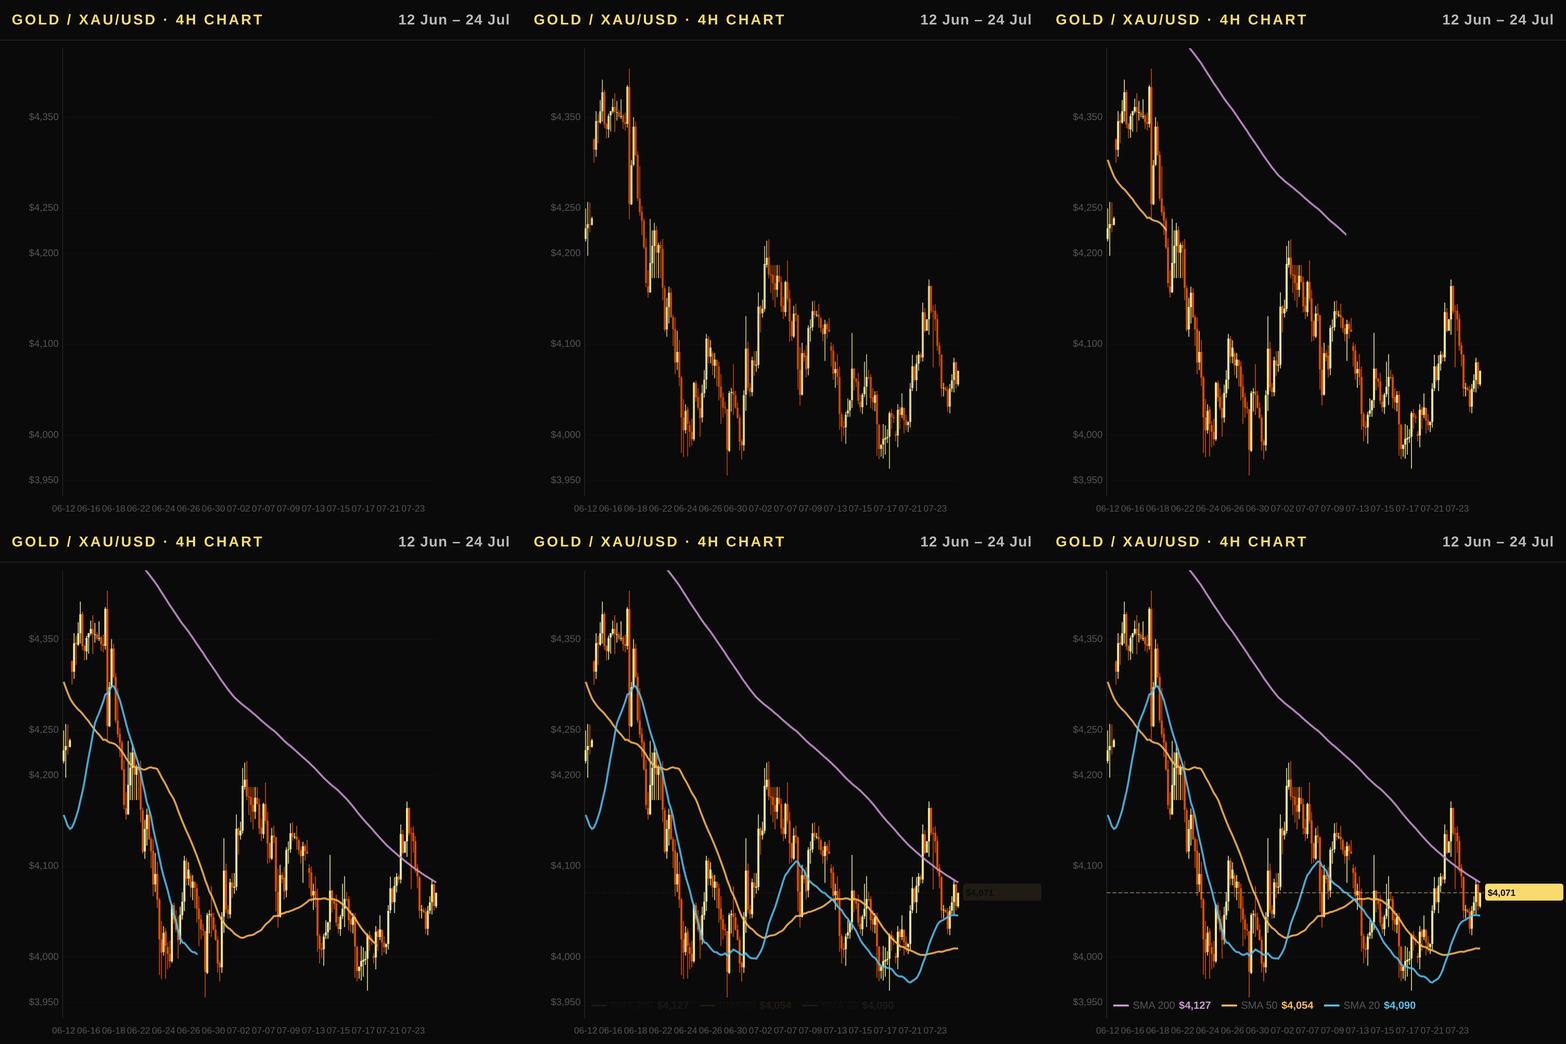
Bearish-to-Neutral. Gold trades below its 50-day and 200-day moving averages with a negative MACD line, indicating that momentum remains weak despite recent weekly gains as real yields rise and USD strength presses on prices.
Executive Summary
The gold price today in Canada stands at 5,717 CAD/oz, while the global XAU/USD benchmark is quoted near USD 4,068 following a weekly gain of roughly 1.37%. Despite a strong downtrend on technical charts with prices trading below key moving averages, gold analysis reveals lingering safe-haven demand that supports the current valuation against rising real interest rates driven by US TIPS yields at 2.43%. The primary keyword for tracking this asset remains the gold price today, which reflects how local currency weakness and geopolitical volatility continue to offset headwinds from a tightening global rate environment.
Canada Outlook: BoC Policy, the Loonie, and Gold in CAD
- Canadian investors buy gold priced directly in Canadian dollars; consequently, a weaker loonie versus the US dollar pushes the local price higher while a stronger currency exerts downward pressure on the CAD-denominated asset. Today's exchange rate stands at 1.4094, translating the global benchmark of $4,067.6/oz into approximately CAD 5,717.
- The loonie acts as a commodity-linked currency that correlates closely with oil and metals prices; WTI crude is rallying strongly this week by +8.27%, providing a structural floor for the local dollar even as it trades slightly lower against US rates in percentage terms over the last month (-0.95%).
- The Bank of Canada maintains its policy rate at 2.25% while focusing on its domestic inflation target; with US CPI currently running at 3.73%, the Fed remains more restrictive, creating a yield differential that typically supports a softer loonie and offers local buyers better purchasing power for international bullion.
- Domestic economic stability is underpinned by GDP growth of 1.7% in 2025 against an annual inflation rate of 2.1%; this balanced macro backdrop allows the central bank to hold rates steady, preventing a sharp appreciation that would otherwise erode gold returns when measured in CAD terms.
Technical Analysis
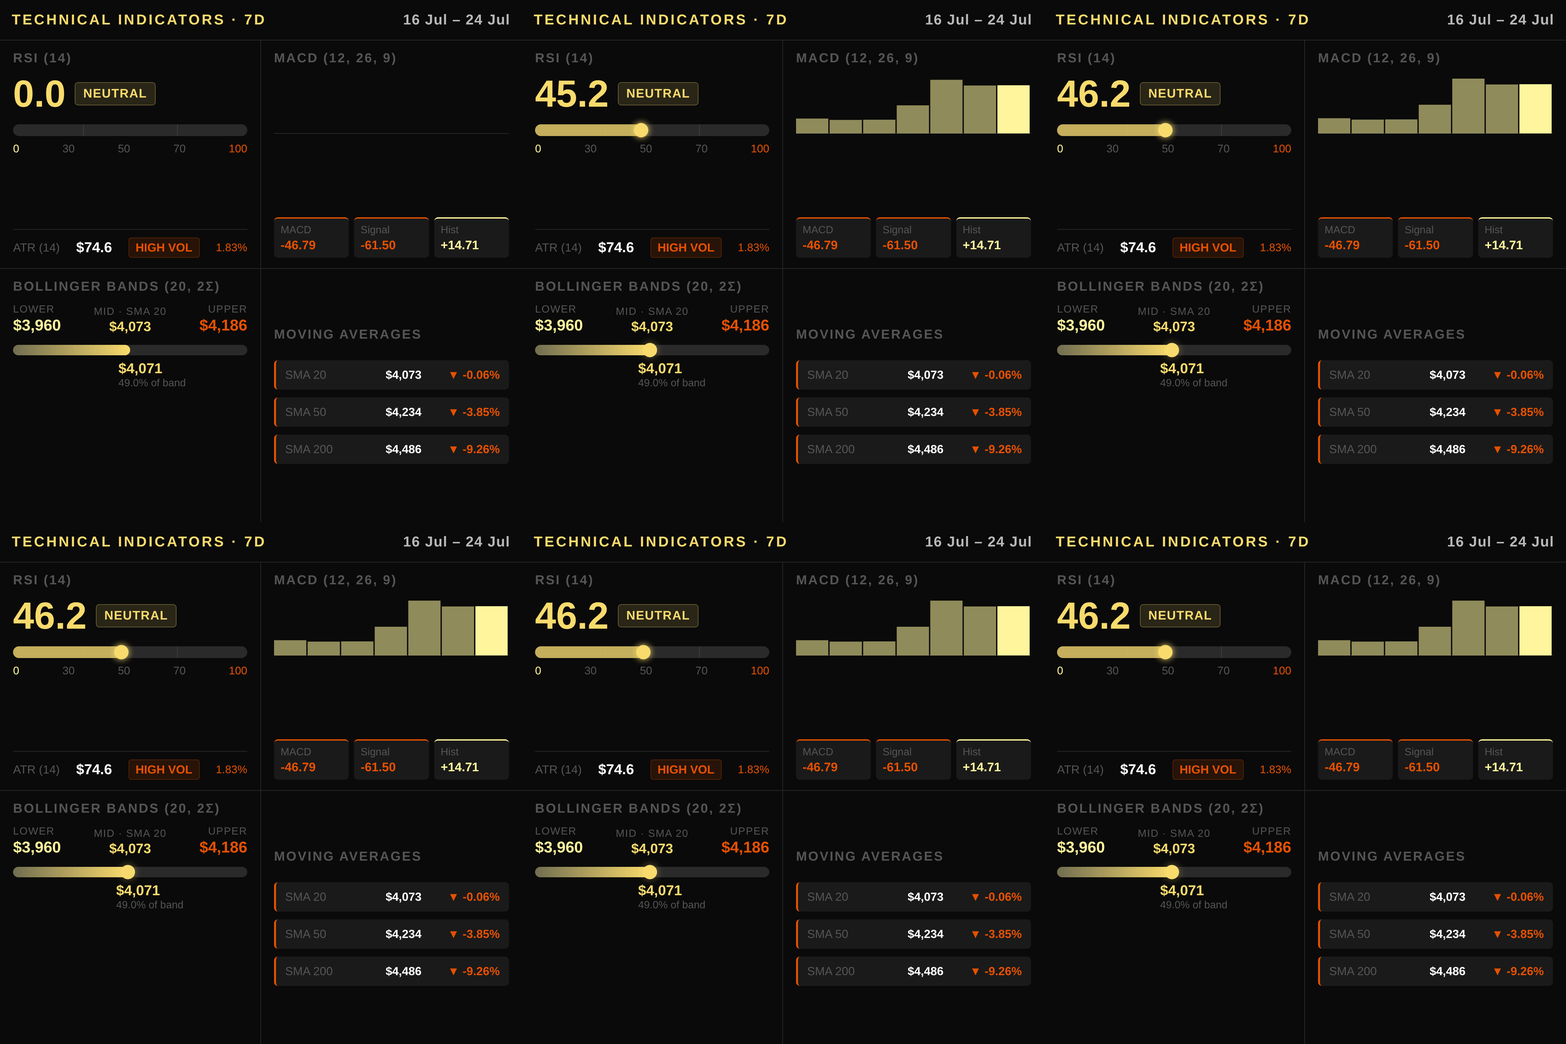
Gold is trading at $4067.6 USD, which sits just below the 20-day simple moving average of $4073.1 and clearly under the longer-term averages at $4233.9 for the 50-day SMA and $4486.4 for the 200-day line. This structure confirms a strong downtrend as price action remains suppressed beneath key overhead resistance zones that define the immediate correction path. The Relative Strength Index stands at 46.2, indicating neutral-to-bearish momentum while hovering below the critical level of 50; this suggests selling pressure is active but not yet in oversold territory where a bounce might accelerate. Momentum further supports caution as the MACD line registers -46.79 against a signal line at -61.5, though the positive histogram value of +14.71 signals that downside velocity is modestly easing without reversing the broader bearish trajectory. Volatility context provided by an ATR reading of 74.6 illustrates normal market noise around these levels rather than extreme instability or breakout conditions. The Bollinger Bands frame this corrective action with a middle band at $4073.1 coinciding with the short-term average, while upper and lower bands sit respectively at $4186.4 and $3959.8; price currently hovers near the center of this range without testing either extreme yet. Key support sits firmly at the 60-day low near $3962.5 USD or approximately CAD 5,597 after conversion using today's exchange rate, whereas significant resistance looms ahead around the $4186.4 upper band and extends further to the monthly high zone of $4233.9 above which lies the broader structural hurdle at $4486.4 USD equivalent to roughly CAD 6,405 on a rising path toward prior highs near $5586.
Macroeconomic Factors
The trajectory of US monetary policy remains a primary driver for gold, with the Federal Reserve holding its funds rate steady at 3.63% against an annualized CPI inflation reading of 3.73%. This environment sustains real borrowing costs that are elevated relative to historical norms, as evidenced by the current 10Y Real Rate (TIPS) yield standing at 2.43%, which significantly increases the opportunity cost for holding non-yielding gold assets. While the nominal US 10Y Treasury yield sits near 4.47% and the yield curve remains normal with a positive spread of 0.36% between the two- and ten-year notes, the persistent strength in real rates acts as a structural headwind against price appreciation. Consequently, gold faces pressure whenever the dollar strengthens or yields climb higher, limiting upside momentum until central bank easing becomes more certain. Geopolitical tensions continue to provide periodic support for safe-haven demand, yet this premium is often insufficient to offset the drag from high opportunity costs associated with current real interest rates.
Positioning and Market Flows
The COT report shows non-commercial speculators holding a net long position of 183,910 contracts in gold futures (XAU/USD), with speculative bias tilted bullish amid rising geopolitical risk premiums. Commercial traders maintain their typical hedging stance at -213,199 contracts, reflecting producer protection against price declines rather than directional bets on bullion direction.
Contrary to this underlying optimism, spot market sentiment has weakened considerably as investors withdrew from exchange-traded funds (ETFs). Monthly ETF flows registered a net outflow of $-9,186 million in USD terms over the past month, indicating that institutional and retail shareholders are offloading paper gold shares rather than accumulating physical holdings. This divergence suggests caution among cash-rich entities while futures markets anticipate further upside driven by safe-haven demand.
Central bank purchases continue to provide a structural floor for prices across all major currencies including CAD as global reserve managers diversify away from traditional fiat assets amid persistent inflation concerns and currency debasement fears worldwide.
Correlated Assets
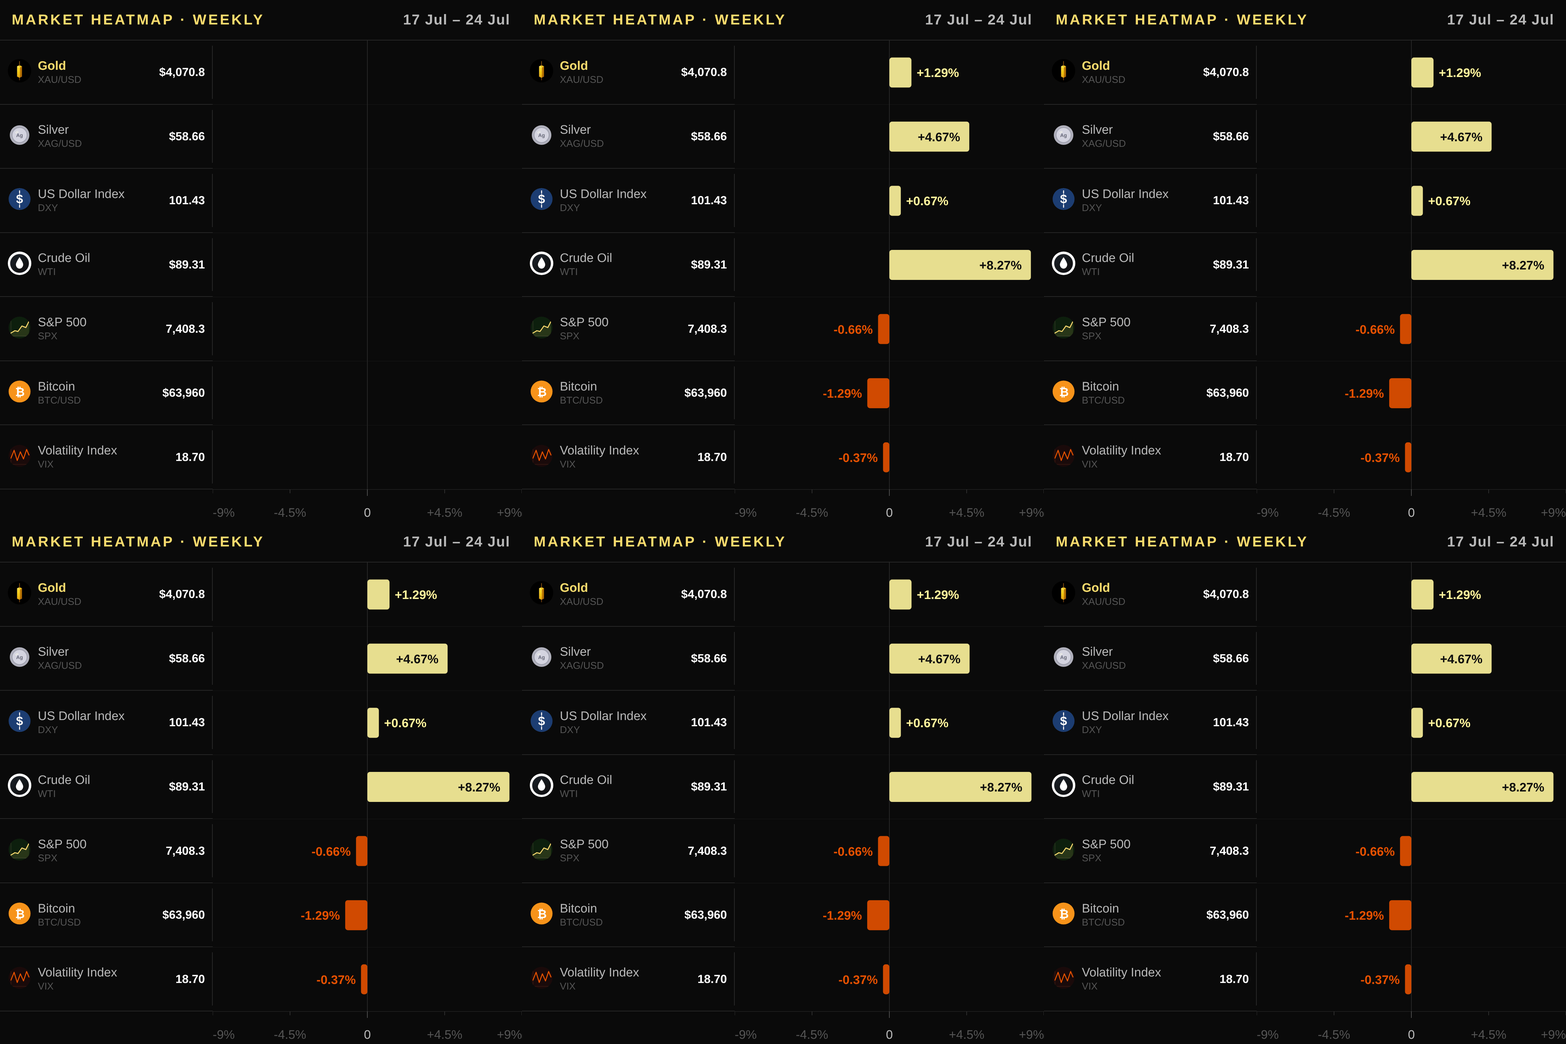
Gold's relationship with key macro drivers reinforces its current bearish technical structure, primarily through the US Dollar Index (DXY) which has risen 0.69% weekly at 101.43. The inverse correlation between gold and DXY remains intact; a stronger dollar makes XAU/USD more expensive for foreign buyers, dampening global demand despite geopolitical tensions that often trigger safe-haven flows.
The US Treasury yield curve presents mixed signals with the 10Y nominal rate at 4.703% up 2.93% weekly and real rates implied by TIPS rising to 2.43%. Higher yields increase opportunity costs for holding non-yielding gold, exerting downward pressure on prices even as risk-off sentiment persists in the broader market.
Industrial metals like copper provide a fundamental counterweight with WTI oil at $89.31/barrel up significantly this week and silver rallying 4.67% to $58.656/oz. The commodity complex's strength supports CAD indirectly, but gold remains sensitive specifically to real interest rates rather than broad industrial demand cycles alone.
The S&P 500 fell 1.67% weekly while the VIX fear gauge jumped 11.78%, creating a divergence where equity weakness typically boosts safe-haven flows yet failed to offset rising US yields effectively this session. Bitcoin declined 1.95% to $63,960 despite its historical resilience during regional conflicts, suggesting capital rotation preferences remain distinct from traditional precious metals even in volatile market conditions.
Upcoming Catalysts
- US Gross Domestic Product — 2026-07-30: A key quarterly gauge of economic health that influences Fed rate expectations and dollar strength, both critical for gold's direction.
- US Non-Farm Payrolls — 2026-08-07: The monthly employment report shapes labor market assessments which drive inflation data interpretations and subsequent central bank policy decisions.
- US Consumer Price Index — 2026-08-12: This headline inflation release is the primary determinant for Federal Reserve interest rate trajectory, directly impacting real rates and gold's opportunity cost.
- US Producer Price Index — 2026-08-13: Changes in wholesale prices often serve as a leading indicator for consumer inflation trends observed later in Consumer Price Index reports.
Trading Idea
A short position in XAU/USD is advised as gold trades within a strong downtrend below its 50- and 200-day moving averages, with an entry zone between USD 4,170–4,360 (CAD 5,890–6,160). Investors should place stop-loss orders above the recent Bollinger Band upper level at USD 4,186.4 or CAD 5,921 to limit downside risk if a technical rebound occurs. The primary profit target is set near the 60-day low support of USD 3,962.5 (CAD 5,627), where further selling pressure could emerge amid elevated real yields and persistent ETF outflows. Canadian investors can execute this strategy via short positions on leveraged inverse gold ETNs or by utilizing margin accounts, while physical holders may consider timing their sales near the stop-loss level to realize gains before potential downside acceleration.
Price Outlook and FAQ
Gold is expected to trade between USD 3,940–USD 4,185 tomorrow (CAD 5,672–CAD 5,905), with a neutral-to-bearish one-week bias as the metal tests support near its 60-day low. The primary driver remains high real yields and persistent ETF outflows that limit upward momentum despite recent weekly gains.
Is gold currently an effective inflation hedge for Canadian investors given rising US CPI? With US annual CPI at 3.73% while the 10Y Real Rate (TIPS) sits near 2.43%, real yields remain elevated enough to suppress non-yielding asset demand, making gold a less reliable hedge than in low-rate environments. Canadian investors should monitor whether inflation expectations diverge from these high real rates, as that divergence is required for sustained bull runs in XAU/USD prices today.
How do Bank of Canada and Fed rate decisions impact the CAD price of gold? The Bank of Canada’s policy rate at 2.25% contrasts with the higher US Funds Rate around 3.63%, keeping USD/CAD elevated, which naturally drags down the local currency value of gold when converted from dollars. A weaker loonie driven by a widening BoC–Fed spread or rising oil prices would offset some headwinds from high real rates for domestic holders buying CAD-priced bullion or ETFs like CGL.TO.
What are the best ways for Canadian investors to purchase physical and paper gold? Traders can gain exposure via the iShares Gold Bullion ETF (CGL.TO) on the TSX or use Sprott Physical Gold Trust shares (PHYS), both of which track spot prices without storage fees in many cases. For tangible holdings, buyers should source Royal Canadian Mint bars or Maple Leaf coins from authorized dealers to ensure purity and legal tender status under Canadian law.
This article is for informational purposes only and does not constitute investment advice or a financial recommendation. Investing in financial assets involves risk.
Key Takeaways for Traders
- Market Stance: The gold market remains bearish as price action holds below critical moving averages and real rates climb; traders should treat recent rallies with caution unless a confirmed break above $4,235 USD occurs.
- Key Technical Level: Watch the 60-day resistance at $4765.2 alongside the RSI approaching neutral territory near 46, as failure to reclaim this level reinforces downside pressure toward support near $3962.5.
- Macro Driver: Monitor rising US real rates via TIPS yields, which currently sit at 2.43%, increasing the opportunity cost for holding non-yielding gold and weighing on its USD trajectory.
- Flow Signal: The ETF sector shows continued outflows of approximately $9.19 billion monthly while COT data reveals growing speculative longs that may be pricing in a premature rebound inconsistent with structural trends.
- Risk Consideration: Geopolitical volatility could provide short-term safe-haven spikes, but the broader trend remains negative until real rates stabilize and central bank demand provides an adequate floor for prices above current levels.
