Market Bias
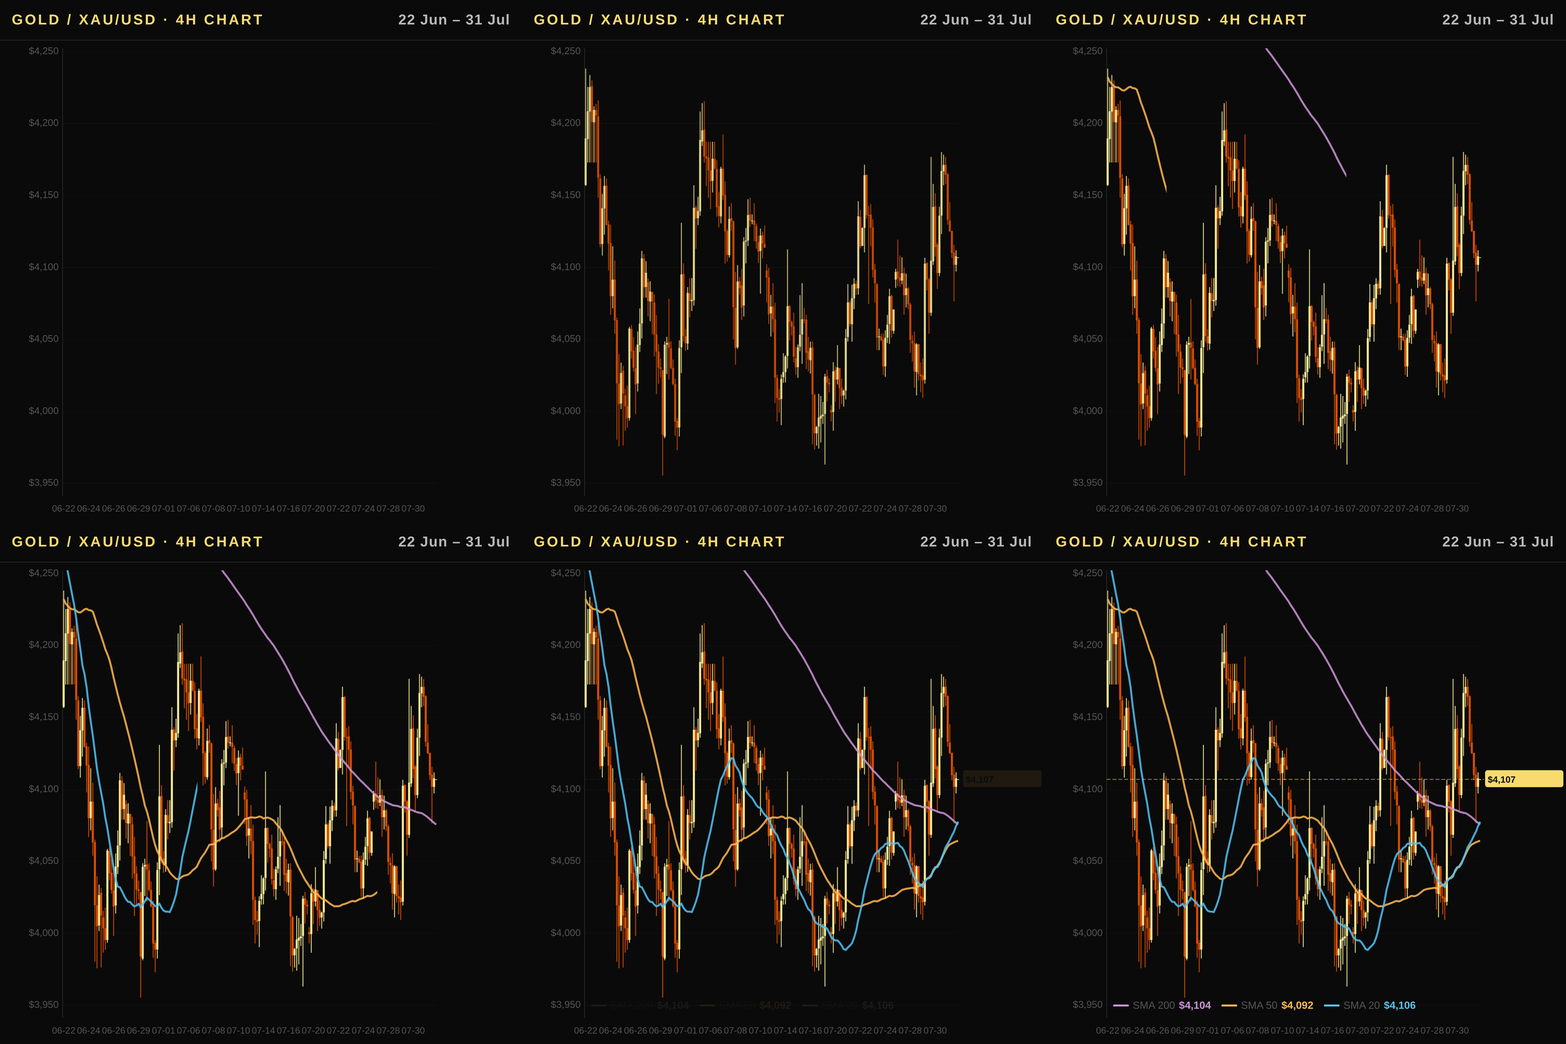
Bearish: XAU/USD is trading below its 50-day moving average at $4,187.9 and 200-day average at $4,483.7 while holding only just above the SMA 20 of $4,070.1. The asset remains in a confirmed downtrend with prices well detached from the 52-week high near $5,586. Although RSI sits marginally neutral at 50.2 and MACD histogram shows easing downside momentum via a positive reading of 15.58, the structural bias stays negative without clear confirmation of trend reversal.
Executive Summary
The gold price today in Canada (CAD) is trading at 5,668 CAD/oz against a USD equivalent of $4,107, reflecting strong one-week gains despite persistent macro headwinds. A significant net outflow of roughly $9.2 billion from global bullion ETFs recently suggests institutional investors are selling paper positions while central bank demand continues to provide structural support for the broader gold market analysis. Technical indicators remain mixed as XAU/USD hovers near its 50-day moving average, creating a volatile environment where Canadian traders must weigh short-term volatility against long-term geopolitical safe-haven dynamics.
Canada Outlook: BoC Policy, the Loonie, and Gold in CAD
- Gold Dynamics: Canadian investors purchase gold priced locally; a weaker Canadian dollar raises the CAD price of foreign-denominated bullion, while a stronger loonie depresses it. With the current rate at 1 USD = 1.4021 CAD, down 1.07% over the past month, the loonie has strengthened and the CAD price of bullion has eased accordingly. Conversely, if US Treasury yields rise relative to Canadian bond rates, capital flows toward dollars depreciate the loonie and lift gold prices measured in Canada.
- Commodity Currency Correlation: The loonie acts as a commodity currency tightly linked to WTI oil trends; recently, WTI futures have climbed 23.26% over the month while weekly strength has moderated by 5.2%. Since CAD often tracks energy and metals prices, rising global risk sentiment supports the local exchange rate against gold in Canada unless geopolitical shocks trigger a flight to safety that overshadows commodity links.
- Bank of Canada Policy: The Bank of Canada maintains its policy rate at 2.25%, focusing on hitting its 2% inflation target while operating independently from Federal Reserve decisions. This current stance creates a specific BoC–Fed differential that influences USD/CAD; if the Fed cuts rates faster than Ottawa, capital inflows seeking Canadian yields would strengthen CAD and depress gold in Canada until domestic price pressures force a hike cycle reversal.
- Inflation & Growth Context: Domestic inflation sits at 2.1% annually while GDP growth recorded for 2025 reached 1.7%. These figures shape the central bank's mandate but do not guarantee immediate cuts; maintaining a stable rate environment preserves currency stability, yet any deviation toward higher real rates or weaker output would pressure CAD and potentially alter local gold valuations significantly without necessarily matching global USD moves directly.
Technical Analysis
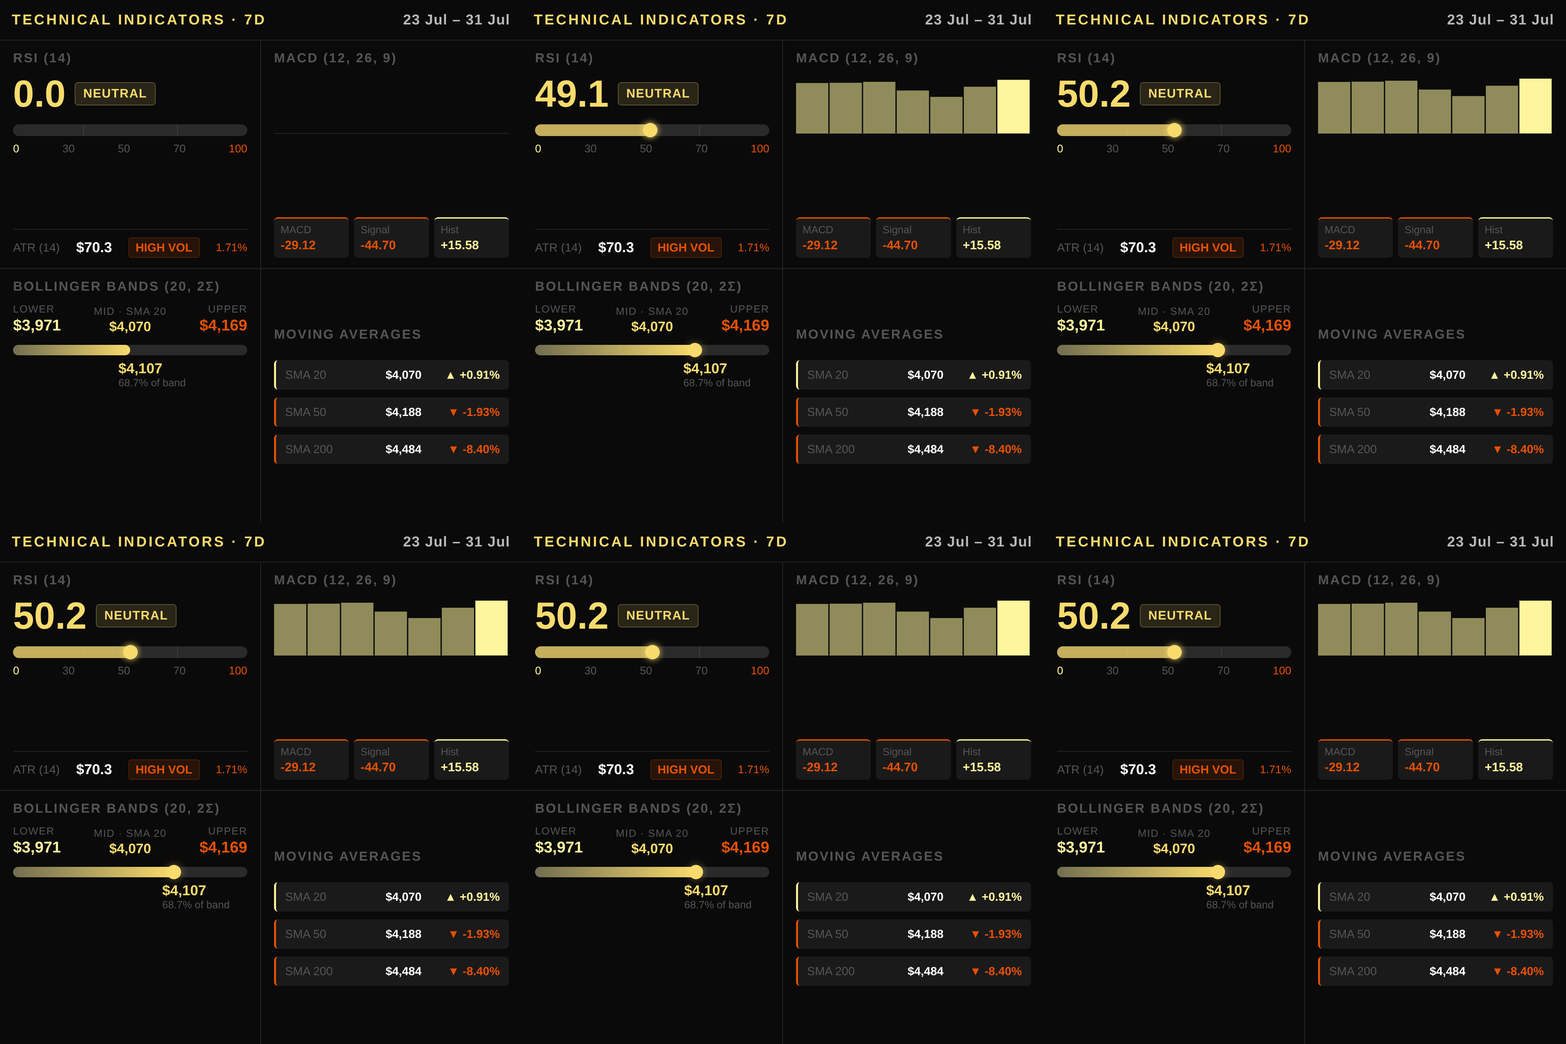
Gold is currently trading at $4107 per ounce, which sits above the 20-day simple moving average of $4070 but remains well below the 50-day and 200-day averages at $4188 and $4484 respectively. This configuration places near-term support just beneath price while overhead resistance looms from the longer-term trends, reinforcing a bearish structural bias despite short-term consolidation. The relative strength index reads 50.2, indicating neutral momentum that lacks clear directional conviction as the asset hovers at its midpoint threshold rather than signaling an oversold rebound or overbought surge.
The MACD line sits at -29.12 with a signal level of -44.69 and a positive histogram value of 15.58, suggesting that while bearish momentum persists, the pace of declines is easing: the MACD line sits above its signal, a bullish crossover inside an established downtrend. Volatility measured by average true range stands at $70.3 per ounce, providing context for stop-loss placement and confirming that price swings remain moderate without extreme expansion or contraction patterns emerging in recent sessions. Bollinger Bands frame the current trading environment with an upper band near $4169, a middle band aligned with the 20-day SMA around $4070, and a lower support level at approximately $3971 that has held as dynamic floor during this corrective phase.
Key resistance levels include the 50- and 200-day moving averages alongside the 60-day high near $4765, which represents significant psychological barriers for any sustained upward break attempt. Below current pricing lies solid support anchored by the lower Bollinger Band at $3971 and the recent 60-day low around $3962, both acting as critical zones where buyers may emerge if selling pressure exhausts itself in this range. Canadian investors viewing these levels must account for currency fluctuations that shift these thresholds proportionally when converting to local pricing terms using today’s exchange rate framework established earlier in our analysis sequence.
Macroeconomic Factors
The Federal Reserve maintains a funds rate of 3.63%, keeping real yields supported by its current trajectory despite recent cooling in nominal inflation. The US Consumer Price Index stands at an annualized pace of 3.73%, which sits above the Fed’s target and sustains higher interest rates that increase the opportunity cost for holding non-yielding gold. Real borrowing costs remain elevated with a 10Y Treasury yield near 4.5% and a real rate derived from TIPS at approximately 2.4%. This environment pressures gold lower as investors weigh capital preservation against the return on assets generating income, though geopolitical tensions can temporarily override this fundamental drag.
The US Dollar Index (DXY) is trading around 99.8 after recording a weekly decline of roughly 1.7% and a monthly drop exceeding 1%. This softer dollar acts as a supportive backdrop for global demand, making gold cheaper for foreign buyers outside the United States. While the yield curve remains normal with an upward-sloping spread between long-term and short-term Treasuries at about half a percentage point, this indicates no immediate recessionary fears that would typically drive flight to safety independently of rate cuts.
Geopolitical instability continues to provide a risk premium for safe-haven assets regardless of the interest-rate environment. The ongoing conflict in regions like the Middle East adds uncertainty that can trigger short-term buying even when real rates are unattractive, though this is often offset by broader market corrections or rising bond yields elsewhere.
Positioning and Market Flows
The CFTC Committee on Trading (COT) report dated July 28 indicates a net speculative long position of 182,070 contracts, reflecting continued bullish sentiment among large institutional speculators despite the recent price decline. However, that net long shrank by 11,949 contracts week-over-week against open interest of 384,603, suggesting that fresh buying is offset by positioning adjustments rather than purely additive demand from new capital entering futures markets at these levels.
ETF data reveals contrasting trends with net outflows totaling approximately $9.19 billion for the June period alone, as investors sold shares to reduce exposure ahead of upcoming rate decisions and mixed macroeconomic data. These significant outflows represent a clear bearish institutional signal that contradicts the bullishness seen in futures positioning, indicating divergence between hedge fund strategies and broader asset manager portfolios seeking liquidity or rotating into other sectors amid elevated real rates driven by US TIPS yields near 2.41%.
Central bank demand continues to provide a structural floor for gold prices independent of retail sentiment and speculative flows. While nation-states have accumulated substantial reserves over the past multi-year period, this steady buying has not been enough to fully negate recent ETF sell-offs or counteract rising opportunity costs associated with the current 3.63% Fed Funds rate environment versus lower yields on non-yielding physical assets.
Correlated Assets
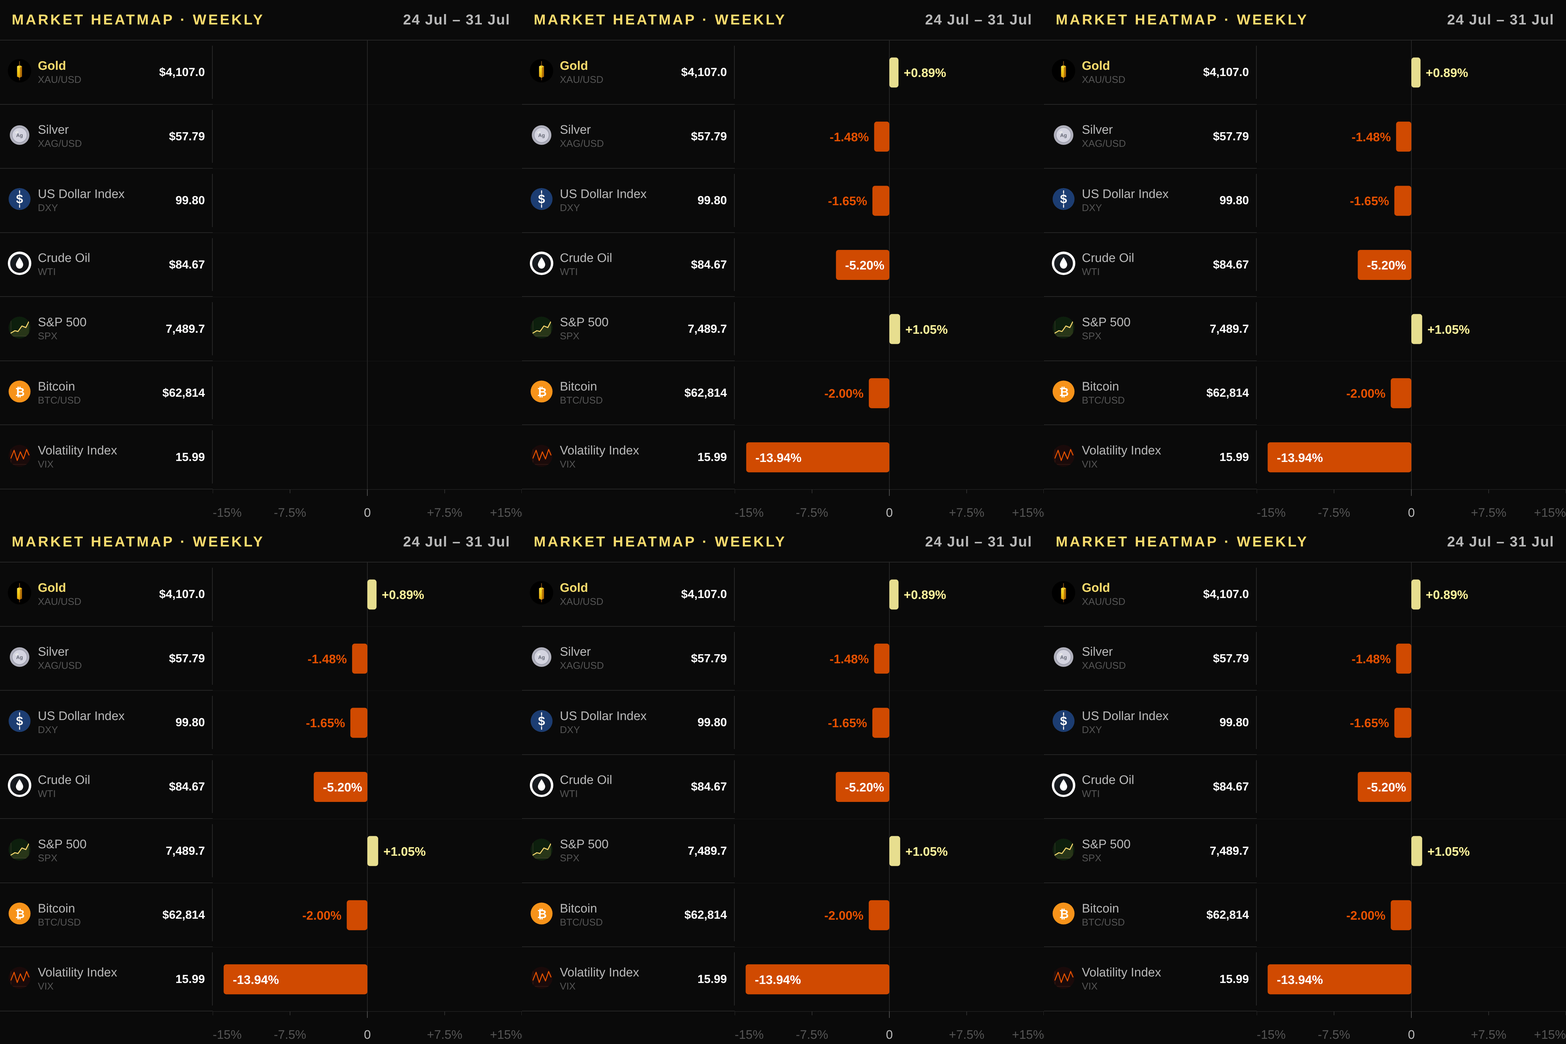
Gold's relationship with major indices reveals a complex interplay between safe-haven demand and risk sentiment, particularly as WTI crude oil drops 5.2% weekly despite climbing 23.26% over the month. This divergence in energy prices creates nuance for Canadian investors, whose loonie remains tied to broader commodity cycles while gold offers a non-correlated hedge against equity volatility. The US Dollar Index (DXY) sits at 99.8, having declined by -1.65% this week and -1.57% over the month; its recent weakness provides tailwinds for XAU/USD as global buyers find bullion cheaper outside of their own currencies. In contrast to gold's defensive posture, copper has advanced steadily with weekly gains of 2.30% and monthly increases of 5.74%, reflecting robust industrial demand that contrasts with the precious metal’s current downtrend structure. Silver mirrors broader commodity weakness, falling -1.48% this week and dropping further at a monthly pace of -4.71%. The S&P 500 index (SPX) advanced +1.05% weekly to 7,489.72, yet its flat performance over the last month suggests equity markets are absorbing geopolitical risk without requiring gold's protective premium to remain elevated. Meanwhile, the CBOE Volatility Index (VIX) has retreated significantly, declining -13.94% this week as market uncertainty eases despite lingering Middle East tensions that often drive safe-haven flows toward physical metals rather than digital assets like Bitcoin, which recently slipped -1.25% weekly from its $63072 level.
Upcoming Catalysts
- US Non-Farm Payrolls — 2026-08-07: A robust report could push real rates higher and weigh on gold, while weak data might reinforce a dovish Fed stance supportive of the metal's price.
- US Consumer Price Index — 2026-08-12: This release will update market expectations for inflation persistence, directly influencing whether investors anticipate further Federal Reserve rate cuts that typically aid XAU/USD.
- US Producer Price Index — 2026-08-13: As a leading indicator for consumer price movements, this data helps confirm the underlying trend of inflation before it is fully reflected in the CPI headline number two days later.
- US Gross Domestic Product — 2026-08-26: This quarterly GDP figure provides critical insight into the resilience of the global economy and potential shifts in risk appetite that could alter safe-haven flows away from gold.
Trading Idea
Given the strong downtrend and bearish technical alignment, we recommend a short position on XAU/USD with an entry zone between USD 4075–4125 (CAD 5,714–5,784). Place your stop loss just above the SMA 50 at USD 4190 (CAD 5,874) to protect against a potential rebound through overhead resistance. The primary target is the 60-day low near USD 3962 (CAD 5,555), which offers downside room based on recent volatility and lack of fundamental reversal signals yet. Canadian investors can execute this bearish trade using physical gold holdings or manage exposure via short positions in iShares Gold Bullion ETF shares if permitted by their brokerage platform.
Price Outlook and FAQ
Gold is expected to trade within a range of USD $3967–$4248 (CAD 5,560–5,950) tomorrow as traders digest mixed technical signals ahead of the week's catalysts. Over the next seven days, the bias remains neutral-to-bearish given that price sits just above the SMA-20 but beneath the key overhead resistance at USD $4187 (CAD 5,863).
Is gold still an effective inflation hedge for Canadian investors when CPI is rising? Yes, gold continues to serve as a non-yielding asset that preserves purchasing power against persistent US and global price pressures. While current annual US CPI stands at 3.73%—well above the Bank of Canada's 2% target—the real rate environment remains supportive; with TIPS yields holding steady near 2.41%, gold’s positive correlation to inflation provides a distinct buffer compared to fixed-income assets when prices rise faster than nominal rates adjust.
How do Federal Reserve and Bank of Canada interest-rate decisions impact the CAD price of gold? Gold in CAD moves inversely with both currencies, driven by real yields and exchange rate dynamics rather than just domestic policy alone. When US Treasury yields remain elevated or the Fed holds rates while the BoC maintains its 2.25% stance, a stronger USD typically pushes down CAD-denominated prices unless commodity flows weaken the loonie; conversely, if higher TIPS yields suppress demand for cash equivalents, gold can rally even as real borrowing costs rise.
What are the best ways for Canadian investors to purchase physical or exchange-traded gold? Canadian residents have direct access via the iShares Gold Bullion ETF (CGL.TO) and Sprott Physical Gold Trust (PHYS), which offer low-cost exposure on the TSX without storage hassle. For those preferring tangible assets, Royal Canadian Mint bars and Maple Leaf coins remain highly liquid options available at most local bullion dealers across Canada.
This article is for informational purposes only and does not constitute investment advice or a financial recommendation. Investing in financial assets involves risk.
Key Takeaways for Traders
- Current Market Stance: The XAU/USD market remains bearish as price trades below both the SMA 50 and SMA 200, confirming a technical downtrend rather than a correction within an uptrend; traders should focus on short setups near resistance levels while waiting for confirmation of a trend reversal before adding long positions.
- Key Technical Level: Watch the USD 4169–4187 zone closely this week as price approaches the Bollinger Upper Band and SMA 50, which act as dynamic overhead resistance that must be cleared to invalidate the immediate bearish bias for Canadian investors buying gold in CAD.
- Macro Driver: Monitor US inflation data relative to real yields (TIPS at 2.41%), noting that rising real rates increase opportunity costs for holding non-yielding gold and typically exert downward pressure on prices until central banks pivot more aggressively toward easing cycles.
- Flow Signal: Large ETF outflows of roughly $9.19 billion over the month highlight institutional selling pressure, which outweighs supportive COT speculative positioning as hedge funds accumulate long contracts despite broader portfolio rebalancing away from precious metals into higher-yielding assets.
- Risk Consideration: A sudden surge in geopolitical tension or a sharp drop in WTI oil prices could momentarily support gold via safe-haven flows even if technical levels remain bearish, but Canadian investors should be cautious of volatility spikes near the $3962 USD / ~$5,555 CAD local support level.
