Market Bias
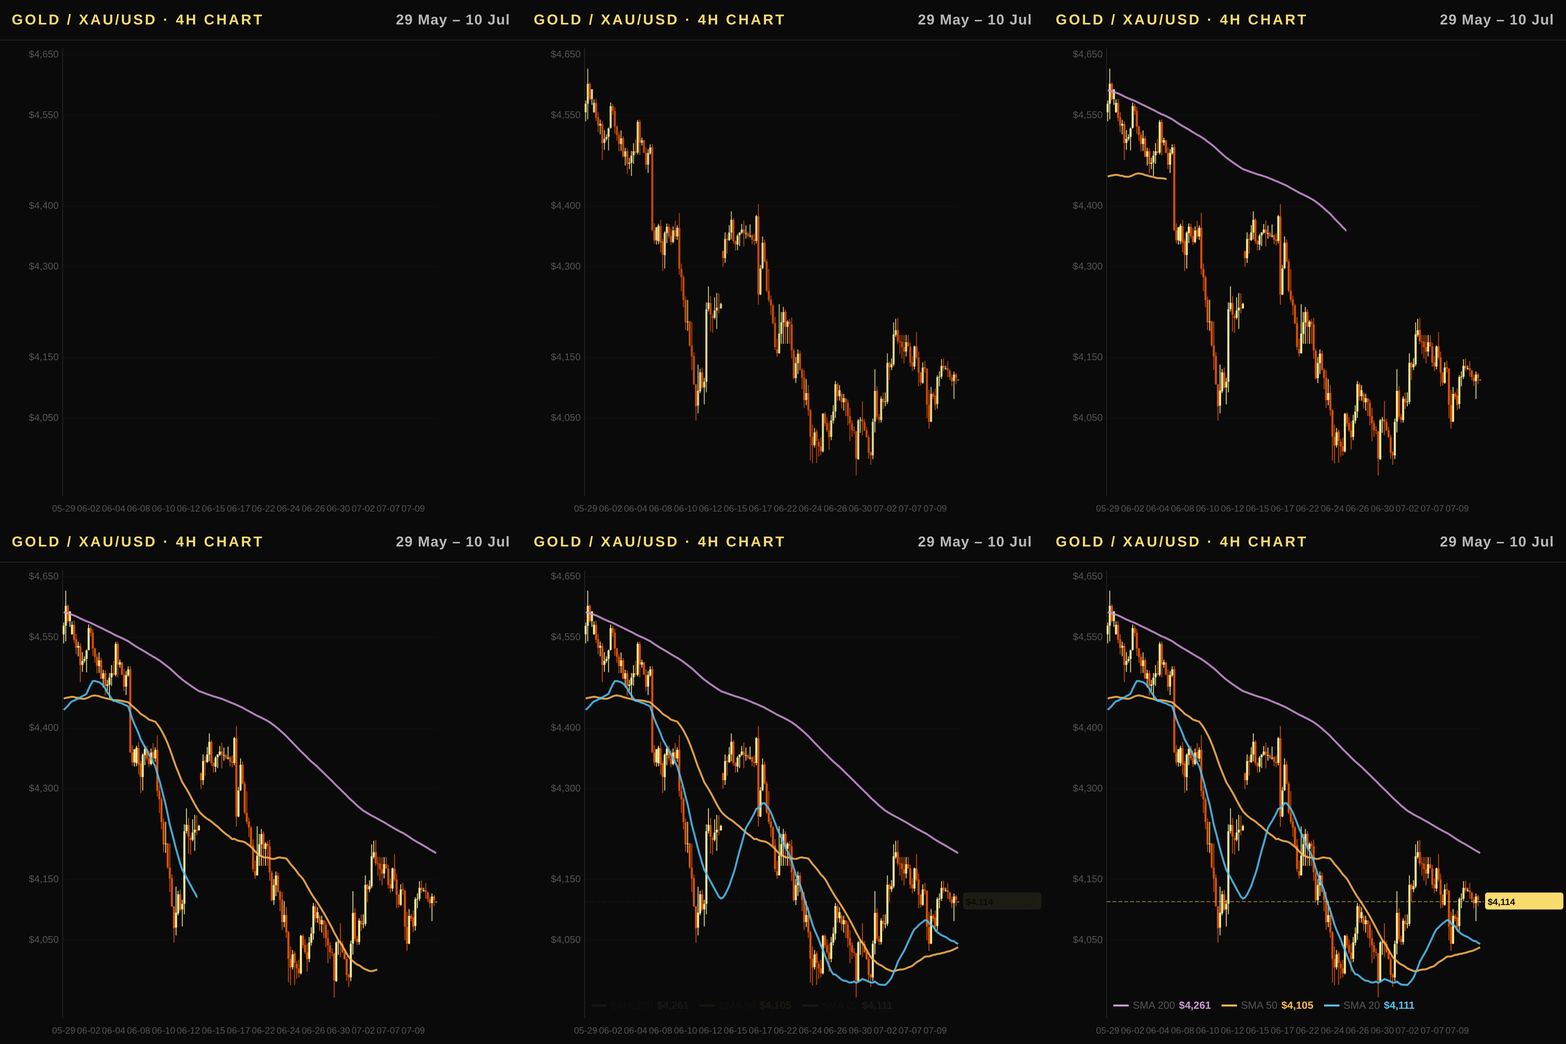
Bearish – Gold is trading below all key moving averages with a negative MACD line, reflecting strong downward pressure despite recent safe-haven support from geopolitical tensions and rising oil prices that weaken the loonie locally.
Executive Summary
The gold price today in Canada stands at 5,821 CAD/oz versus USD $4,113.70 as of July 12, 2026, reflecting a strong downtrend over the past week with a -1.76% decline despite year-to-date gains exceeding 22%. The current gold price today in Canada is pressured by rising real rates and ETF outflows totaling approximately $1.97 billion last month, which signal a cautious institutional stance even as geopolitical risks provide occasional safe-haven support. While the Bank of Canada maintains its policy rate at 2.25%, creating a favorable CAD/USD environment for local gold prices when the loonie weakens, macro headwinds from a strengthening US Dollar Index and higher TIPS yields continue to cap upside momentum in this gold price today analysis.
Canada Outlook: BoC Policy, the Loonie, and Gold in CAD
- Canadian investors benefit when a weaker loonie pushes gold prices higher; currently priced at CAD 5,821/oz, this local value reflects the exchange rate of 1.4157 against the US dollar. A strengthening CAD would directly increase buying costs for domestic holders and exert downward pressure on the quoted price in Canadian currency terms.
- The loonie acts as a commodity-linked currency correlated with global risk sentiment; while WTI oil has recently risen by 3.82% weekly, supporting the broader metals complex, any sustained weakness in CAD would provide a mechanical tailwind for XAU/CAD even if USD gold were flat. Conversely, a strong dollar index environment often pulls Canadian investors toward US-denominated assets unless local inflation dynamics diverge significantly from global peers.
- The Bank of Canada currently maintains its policy rate at 2.25%, creating a significant interest-rate differential relative to the Federal Reserve’s funds rate of 3.63%. This wider BoC–Fed spread typically supports loonie strength by reducing carry trade incentives for holding US dollars, thereby providing structural support against immediate CAD depreciation that could otherwise boost domestic gold valuations artificially via currency translation effects alone.
- Domestic inflation remains contained at 2.1%, well below the Bank of Canada’s 2% target threshold which prevents aggressive rate hikes from eroding household purchasing power or forcing premature dollar appreciation cycles unrelated to fundamentals like global demand for commodities such as copper and oil exports that underpin CAD value stability over longer horizons than typical market noise suggests otherwise today
Technical Analysis
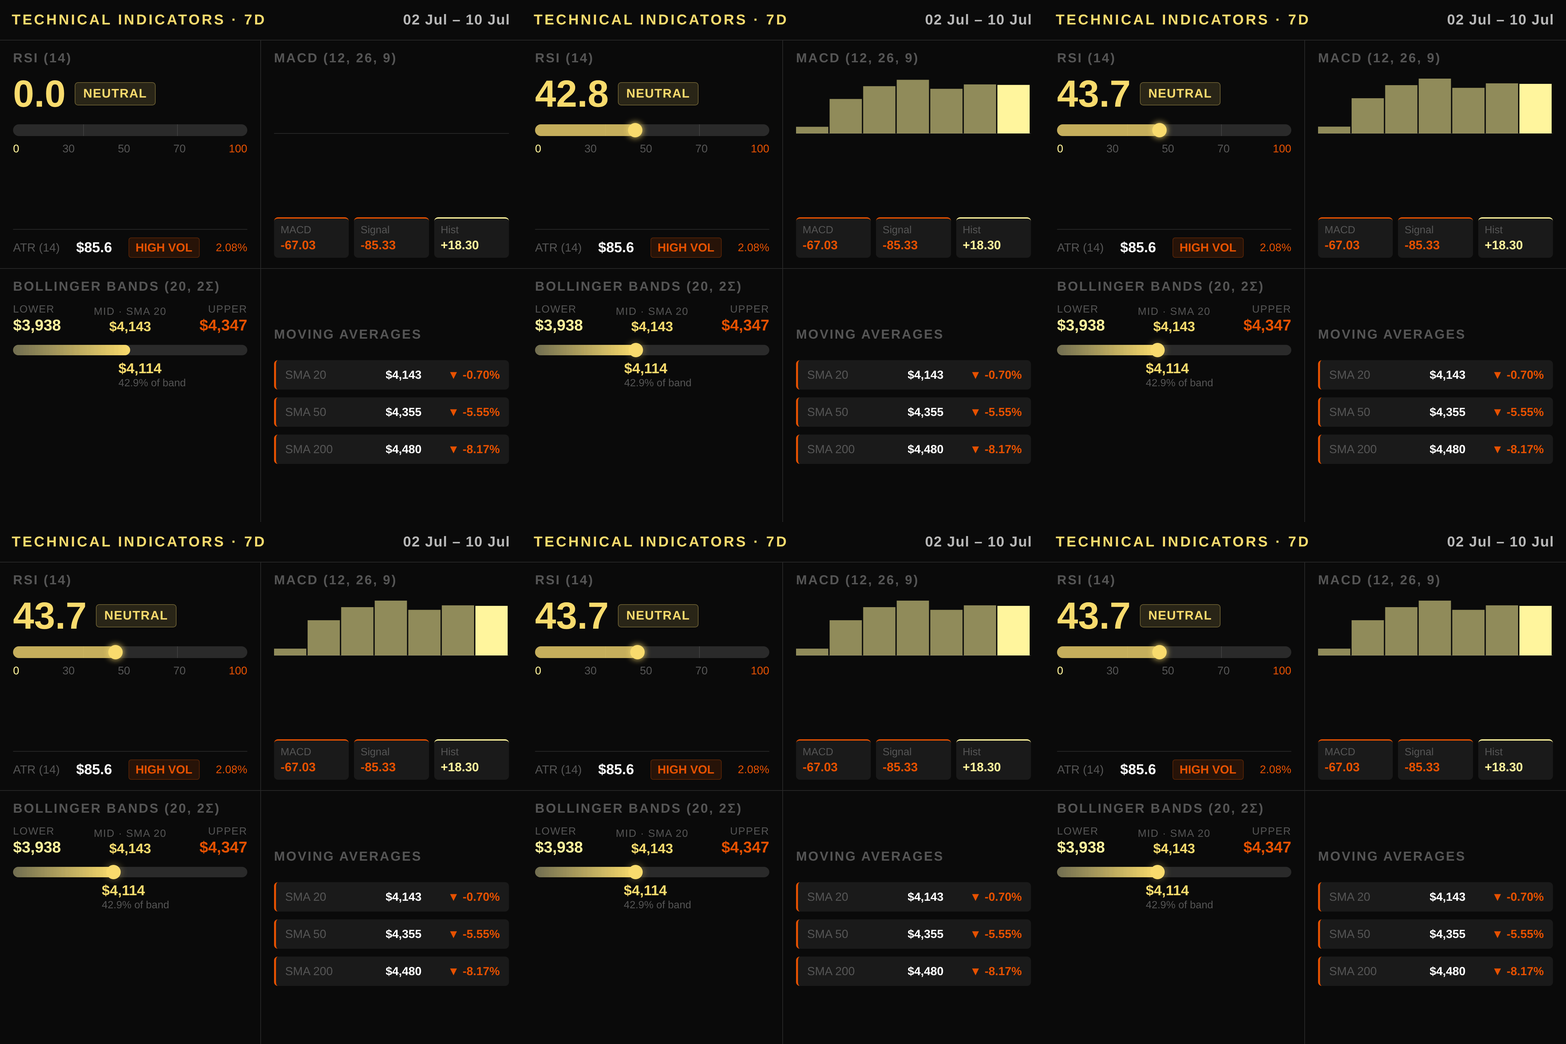
Gold price today in USD sits at $4113.7, firmly below all major moving averages as the 20-day average ($4142.8), 50-day SMA ($4355.3), and 200-day line ($4479.9) act as overhead resistance in this strong downtrend structure. The RSI at 43.7 indicates bearish momentum while remaining above the oversold zone, suggesting room for further downside before a potential rebound becomes viable. MACD remains negative at -67.03, with the signal line also depressed at -85.33; however, the positive histogram of +18.3 hints that selling pressure may be moderating slightly as the bulls attempt to reclaim ground near the 20-day moving average. Bollinger Bands show tight contraction around $4347.3 (upper), $4142.8 (middle), and $3938.2 (lower); current price trades just below the middle band, signaling weakness within this volatility envelope. ATR of 85.6 reflects elevated short-term fluctuations typical for non-yielding assets under macro uncertainty. Key support sits at the 60-day low around $3962.5 USD (~$5614 CAD), while resistance looms near the 60-day high at $4811.0 USD (~$6814 CAD). Canadian investors should monitor how price interacts with these levels, especially given that a break below support could accelerate downside toward next year’s lows in this bearish environment.
Macroeconomic Factors
The Federal Reserve maintains its benchmark rate at 3.63%, with recent data indicating a stable policy stance that leaves real borrowing costs elevated for non-yielding assets like gold. The US economy continues to show resilience, yet the trajectory of inflation remains critical; current annual CPI stands at 4.27%, which translates to real interest rates measured by the 10Y Real Rate (TIPS) yield at a robust 2.31%. This elevated TIPS yield increases the opportunity cost for holding gold, creating persistent headwinds that counteract safe-haven demand in a non-inflationary environment.
The US Dollar Index trades near parity with its previous month's level but remains firm against major currencies due to this real rates dynamic. A stronger DXY makes XAU/USD more expensive for international buyers outside the United States, dampening global demand and putting downward pressure on prices. Conversely, a weakening dollar would typically stimulate foreign inflows into gold markets as investors seek cheaper entry points in US-denominated assets.
Geopolitical tensions continue to provide an intermittent floor under the price of gold, offering a risk premium even when technical indicators suggest weakness. While central banks have been diversifying reserves away from traditional safe-haven currencies over recent years, this structural demand is currently being weighed against the higher yields available in US Treasuries. Market participants must monitor whether geopolitical instability or shifting fiscal policies will eventually outweigh the fundamental drag of high real interest rates on gold prices today.
Positioning and Market Flows
COT data reveals a bullish speculative stance in gold futures, with non-commercial net longs climbing to 194,246 contracts over the reporting week. This accumulation of long positions by managed money suggests active institutional buying pressure despite recent price weakness, indicating that traders are positioning for potential rebounds as downside momentum stalls near key support zones.
In stark contrast, ETF flows tell a bearish story with net outflows totaling approximately $1.97 billion in May alone. These substantial withdrawals reflect investors selling gold-backed shares to rotate capital elsewhere or reduce exposure, creating a divergence where futures markets anticipate rallies while equity-based demand fades. Such opposing signals require careful weighting: futures positioning often leads price moves ahead of broader investor sentiment shifts visible in ETF data.
Central bank demand continues providing a structural floor for prices through multi-year accumulation programs by central banks globally seeking to diversify reserves away from dollar-denominated assets. While this institutional buying does not appear directly in short-term flow metrics, it creates an underlying bid that supports spot pricing and limits the severity of any drawdowns driven purely by speculative positioning or ETF selling pressure.
Correlated Assets
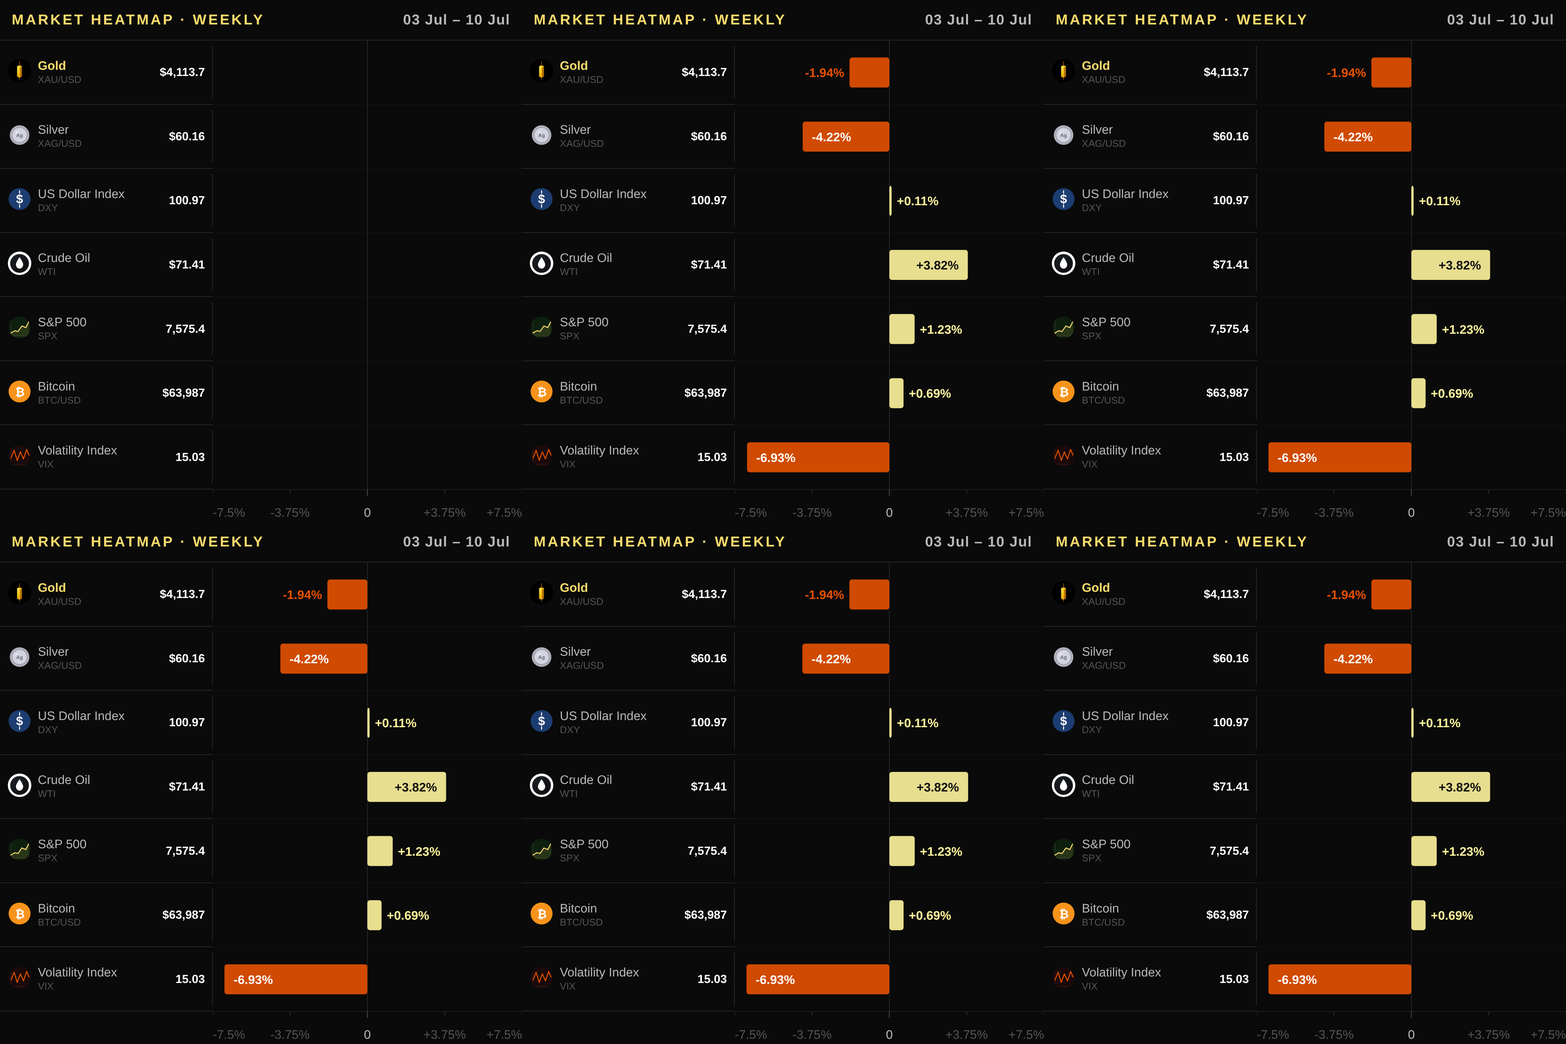
The US Dollar Index (DXY) sits at 100.97, showing modest weekly gains of 0.11% and monthly strength of 1.06%. This slight dollar appreciation exerts mild downward pressure on gold by making the non-yielding asset more expensive for foreign buyers, though it does not yet dominate price action like in prior rallies. Copper trades at USD 6.282 per pound with a positive weekly shift of +0.93% and monthly gain of +0.37%, indicating resilient industrial demand that typically supports broader metal prices alongside gold. Silver lags significantly, down -4.22% this week and -5.82% over the month to USD 60.165/oz; its outperformance relative to copper is muted by lower liquidity but could catch up if risk sentiment improves sharply. WTI crude oil climbed +3.82% weekly despite a monthly decline of -18.58%, reflecting recent geopolitical tensions that occasionally boost the commodity-linked loonie and offer an alternative inflation hedge narrative for Canadian investors. The S&P 500 (SPX) advanced +1.23% this week and +2.56% over the month to 7,575.4 points, suggesting equity markets remain resilient even as gold corrects near technical supports. A falling VIX gauge at 15.03 (-6.93% weekly) signals easing fear, which usually dampens safe-haven flows and weighs on bullion prices unless a geopolitical shock emerges again. Bitcoin rose +1.09% this week to USD 63,987 despite a monthly dip of -0.39%, yet its massive volatility prevents it from being treated as a stable diversifier compared to gold’s historical track record during crises.
Upcoming Catalysts
- US Consumer Price Index — 2026-07-14: Core inflation data is a primary driver of Federal Reserve policy expectations and influences real rates, which directly impact gold's opportunity cost environment.
- US Producer Price Index — 2026-07-15: Wholesale price movements provide early signals on future consumer inflation trends that could alter the path for Fed rate adjustments in September or October.
- US Gross Domestic Product — 2026-07-30: The quarterly GDP print will define whether growth remains resilient enough to support higher-for-longer rates, creating a key divergence scenario between economic strength and bond yields.
- US Non-Farm Payrolls — 2026-08-07: A strong jobs report could delay Fed rate cuts by reinforcing labor market tightness, while weakness would lift the probability of monetary easing that typically supports gold prices in USD terms.
Trading Idea
Given the strong downtrend and bearish technical structure, traders should consider a short position on XAU/USD with an entry zone between USD 4085–4125 (CAD 5783–5839). A stop loss is placed at USD 4165 or CAD 5900 to remain below the SMA 20 resistance, protecting against a bounce back toward the upper Bollinger Band. The primary target sits near USD 3960 (CAD 5617), which corresponds to the recent 60-day low support level where downside momentum should accelerate if technical breakdowns hold. Canadian investors can implement this view by selling short via leveraged products or allocating cash positions in physical gold through Royal Canadian Mint bars and Maple Leaf coins, while alternative exposure exists via the iShares Gold Bullion ETF (CGL.TO) or Sprott Physical Gold Trust (PHYS).
Price Outlook and FAQ
Gold is expected to trade within a range of USD 3,985–4,260 tomorrow (CAD 5,641–6,032), while the one-week bias remains bearish as prices struggle below key moving averages. Tomorrow's lower bound reflects resistance from the SMA 20 and higher volatility ahead of CPI data, whereas the upper target is capped by overhead selling pressure near USD 4,285 (CAD 6,062).
Is gold currently an effective inflation hedge for Canadian investors given recent economic indicators? With US annual CPI at 4.27% while Canada's rate stands at only 2.1%, real purchasing power erosion is occurring faster in the U.S., yet domestic TIPS yields remain elevated; however, gold remains a valid non-yielding store of value when nominal rates stay above inflation expectations without rising further into negative territory for real returns.
How do interest rate decisions by the Bank of Canada and the US Federal Reserve influence gold prices specifically for Canadian holders? The CAD/USD exchange rate acts as the primary transmission mechanism, where a stronger loonie (driven by higher BoC rates relative to Fed policy) makes USD-priced gold expensive in local currency terms, thereby suppressing the CAD 5,821 price even if global demand persists. Conversely, divergences favoring lower real yields and dollar weakness will lift both CAD-quoted bullion prices and ETF flows into domestic accounts like iShares Gold Bullion (CGL.TO).
What are the most accessible ways for Canadian residents to acquire physical or paper gold exposure today? Investors can gain instant access via regulated TSX-listed funds such as the iShares Gold Bullion ETF (CGL.TO) and Sprott Physical Gold Trust (PHYS), while those preferring tangible assets may purchase Royal Canadian Mint bars or official Maple Leaf coins directly from authorized bullion dealers without currency conversion risks.
This article is for informational purposes only and does not constitute investment advice or a financial recommendation. Investing in financial assets involves risk.
Key Takeaways for Traders
-
Market Stance: The gold market is currently bearish as price action trades decisively below all major moving averages, with a confirmed downtrend structure that invalidates any long-term bullish trend narratives for near-term traders. Traders should respect the structural weakness until clear evidence of reversal emerges from key support zones or sustained momentum shifts in futures positioning.
-
Technical Watch: The 60-day low at USD $3962.5 (CAD $5,614) acts as critical support; a decisive break below this level with rising volume would likely trigger algorithmic cascades toward the next lower pivot near USD $3850. Monitor RSI readings approaching oversold territory around 40–45 for potential short-covering bounces that fail to sustain upward momentum in this downtrend environment.
-
Macro Driver: Keep a close eye on real interest rates, specifically the US 10Y Real Rate (TIPS) at 2.31%, as rising yields increase the opportunity cost of holding non-yielding gold and exert persistent downward pressure on prices despite geopolitical tensions. A flattening or inversion in the yield curve could signal slowing growth that might eventually support higher real rates, but currently elevated TIPS are a headwind for XAU/USD.
-
Flow Signal: The bearish sentiment is reinforced by substantial ETF outflows of $-1,969 million last month and commercial hedgers maintaining large short positions in futures markets which reflect producer risk management rather than speculative selling pressure on the metal itself. These institutional flows indicate a lack of immediate demand from Western investors to offset central bank buying at current levels.
-
Risk Consideration: The primary risk for long holders is further downside volatility driven by dollar strength and resilient US employment data, while short sellers must watch for sudden spikes in safe-haven demand that could limit losses near the 60-day low support zone where stop-loss orders from leveraged positions may cluster.
