Market Bias
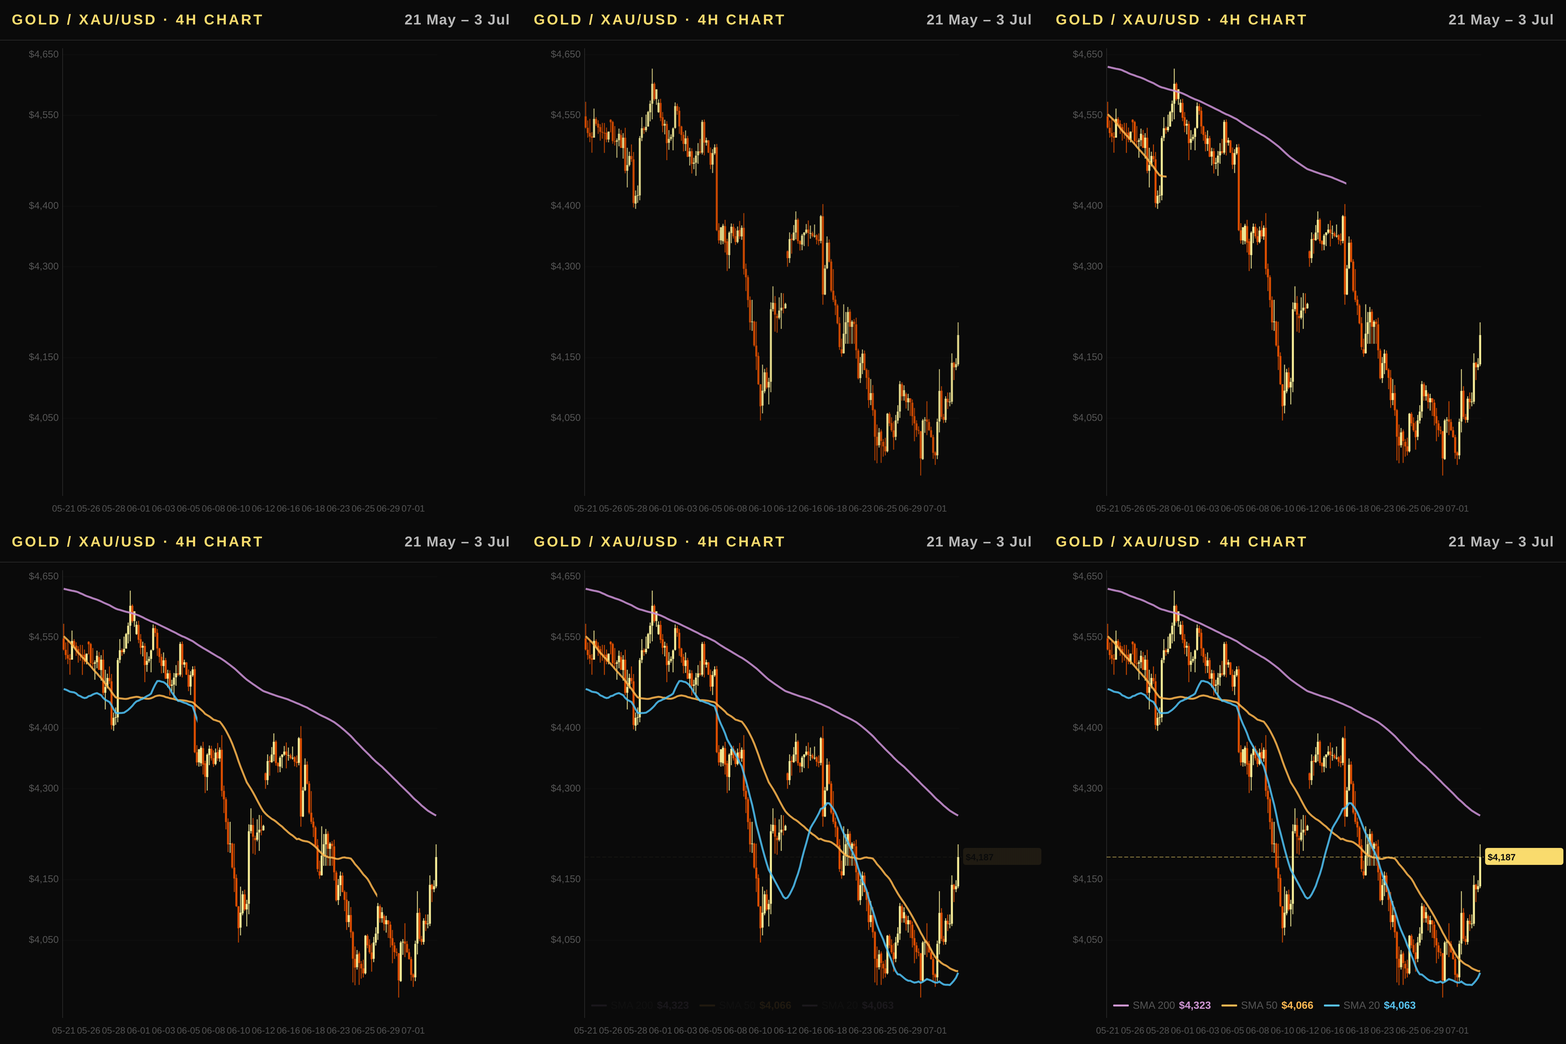
Bearish momentum persists as XAU/USD trades below its 50-day and 200-day moving averages, confirming a corrective phase in an otherwise strong downtrend structure. Although RSI sits near neutral territory at 47.1, the decline from recent all-time highs around $5,600 suggests significant downside pressure remains until price reclaims key overhead resistance zones above $4,880.
Executive Summary
The gold price today in Canada stands at 5,945 CAD/oz as USD bullion trades near $4,187 following a strong weekly gain of 2.66%. Despite recent strength, the XAU/USD market faces headwinds from rising real rates and persistent ETF outflows totaling nearly $2 billion this month. Our gold analysis highlights that while central bank demand remains structural support, speculative positioning shows bullish bias tempered by technical corrections below key moving averages. Canadian investors should monitor the loonie's weakening trend, which has lifted local prices despite global selling pressure in physical markets.
Canada Outlook: BoC Policy, the Loonie, and Gold in CAD
- Gold Performance: Canadian investors benefit from a rising local gold price of 5,945 CAD/oz when the commodity currency weakens against the USD; conversely, a stronger loonie exerts downward pressure on domestic valuations.
- Currency Dynamics: The Bank of Canada policy rate sits at 2.25%, which is below the US Fed Funds Rate of 3.63%; this differential supports a weaker CAD and provides a bullish tailwind for gold priced in Canadian dollars, currently trading near its monthly high despite global corrections.
- Oil Correlation: As Canada's primary commodity currency, the loonie correlates strongly with WTI Oil trends; while oil has dipped 26% month-over-month recently, the broader risk cycle and metal demand often sustain CAD support levels even during periods of falling energy prices.
Technical Analysis
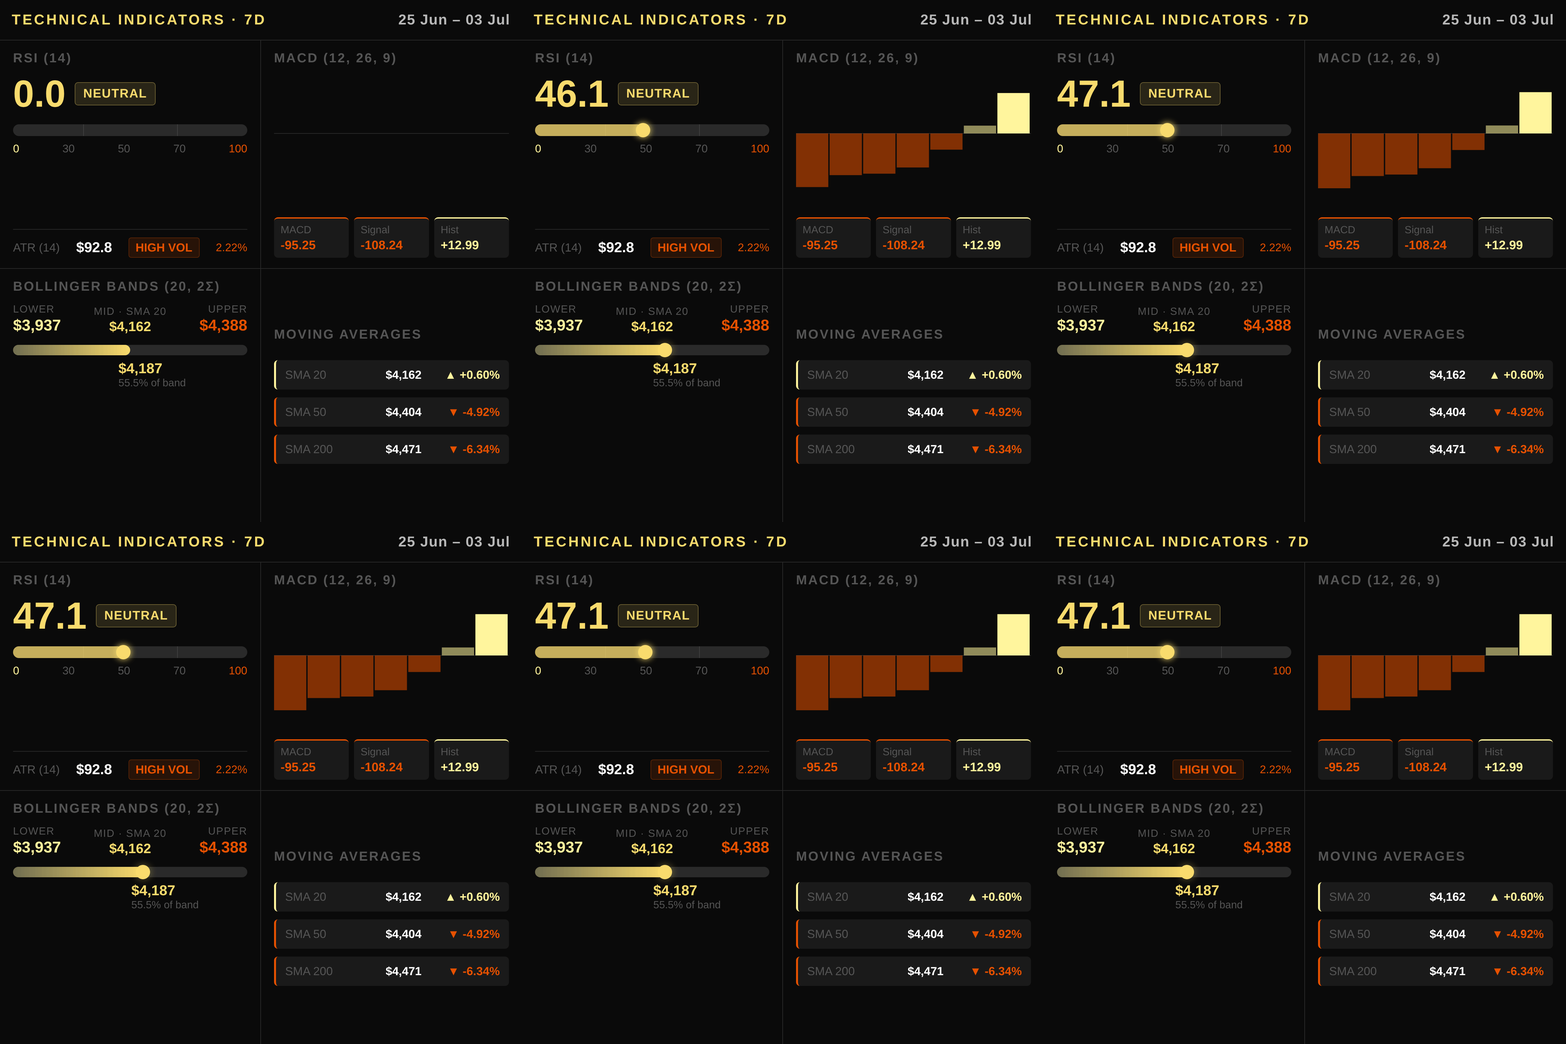
Current price action reflects a strong downtrend in XAU/USD, with gold trading below its key moving averages. The current price of $4187.3 sits just above the SMA 20 at $4162.4 but remains significantly under pressure from the SMA 50 ($4404.1) and SMA 200 ($4470.7), indicating a medium-to-long-term bearish structure that Canadian investors must respect when converting USD levels using the CAD/USD rate of 1.4199.
The Relative Strength Index (RSI) stands at 47.1, placing momentum in neutral territory yet below the psychological level of 50, which aligns with the broader bearish bias observed since gold failed to reclaim its recent consolidation zone. While the RSI is not technically oversold, it lacks sufficient upward thrust to signal an immediate reversal against the heavier overhead resistance provided by the SMA 20 and higher timeframes.
The MACD histogram registers a positive value of +12.99, suggesting that short-term bullish momentum is marginally building as the MACD line (-95.25) recovers slightly relative to its signal line (-108.24). However, both lines remain deeply negative in absolute terms and well below zero baseline levels required to confirm a sustained trend change; this divergence highlights potential volatility spikes rather than structural strength in gold’s underlying trajectory today.
Bollinger Bands frame the immediate trading range between $3936.5 (lower band) and $4388.4 (upper band), with the middle band coinciding exactly at the SMA 20 of $4162.4. The current price sits near the lower half of this channel, suggesting limited upside room unless external catalysts disrupt local Canadian demand or weaken the loonie further to lift gold in CAD terms above its USD equivalent resistance zones.
The Average True Range (ATR) measures volatility at 92.8, confirming that price swings are moderate but capable of pushing stops beyond standard technical levels without a fundamental shift in market sentiment. Traders using stop-loss orders should account for this noise, especially since support near the 60-day low converts to approximately $3971 CAD and resistance above $4532 USD (≈$6480 CAD) looms as key boundaries during periods of elevated dollar strength or global uncertainty.
Macroeconomic Factors
The Federal Reserve maintains a policy rate of 3.63%, while the broader economic backdrop is defined by real interest rates that currently sit at 2.25% according to the 10Y Real Rate (TIPS). This upward drift in TIPS yields increases the opportunity cost for holding non-yielding gold, exerting persistent downward pressure on XAU/USD prices despite recent tactical strength. The US Dollar Index (DXY) is trading near 100.86 after a weekly decline of 0.56%, yet it remains elevated compared to historical norms; a stronger dollar typically makes bullion more expensive for international buyers, dampening global demand outside the United States and Canada.
Geopolitical tensions continue to provide an intermittent safe-haven premium that temporarily offsets fundamental headwinds from real rates. However, investors should note that this risk-off sentiment is not permanent; if geopolitical events de-escalate or financial markets stabilize, gold will revert primarily to its macroeconomic drivers of interest rate differentials and dollar strength. The yield curve remains normal with a positive 10Y–2Y spread of 0.35%, signaling no immediate recessionary pressure that would historically trigger flight-to-safety flows into precious metals on an economic cycle basis.
Positioning and Market Flows
The CFTC Commitment of Traders (COT) report for XAU/USD futures reveals a speculative bias that remains bullish, with non-commercial net long contracts increasing by 27,079 over the last five weeks to reach 181,339. This aggressive accumulation from large institutional speculators highlights strong conviction in gold's upside potential despite recent price corrections and weakening technical momentum.
In contrast to futures market optimism, ETF flows are currently acting as a significant drag on sentiment. The SPDR Gold Shares trust recorded substantial outflows of approximately $-1.97 billion for the month, indicating that many investors are selling paper exposure while holding physical assets or waiting for better entry points. This divergence suggests retail and institutional demand is becoming more selective rather than absent from the market entirely.
Central bank buying continues to provide a structural foundation beneath these short-term fluctuations. Central banks have been accumulating gold reserves as part of strategic diversification efforts, insulating their balance sheets against currency volatility and potential sanction risks. This steady, non-speculative absorption helps prevent deeper drawdowns during periods when private sector demand wanes due to rising real yields or dollar strength.
Correlated Assets
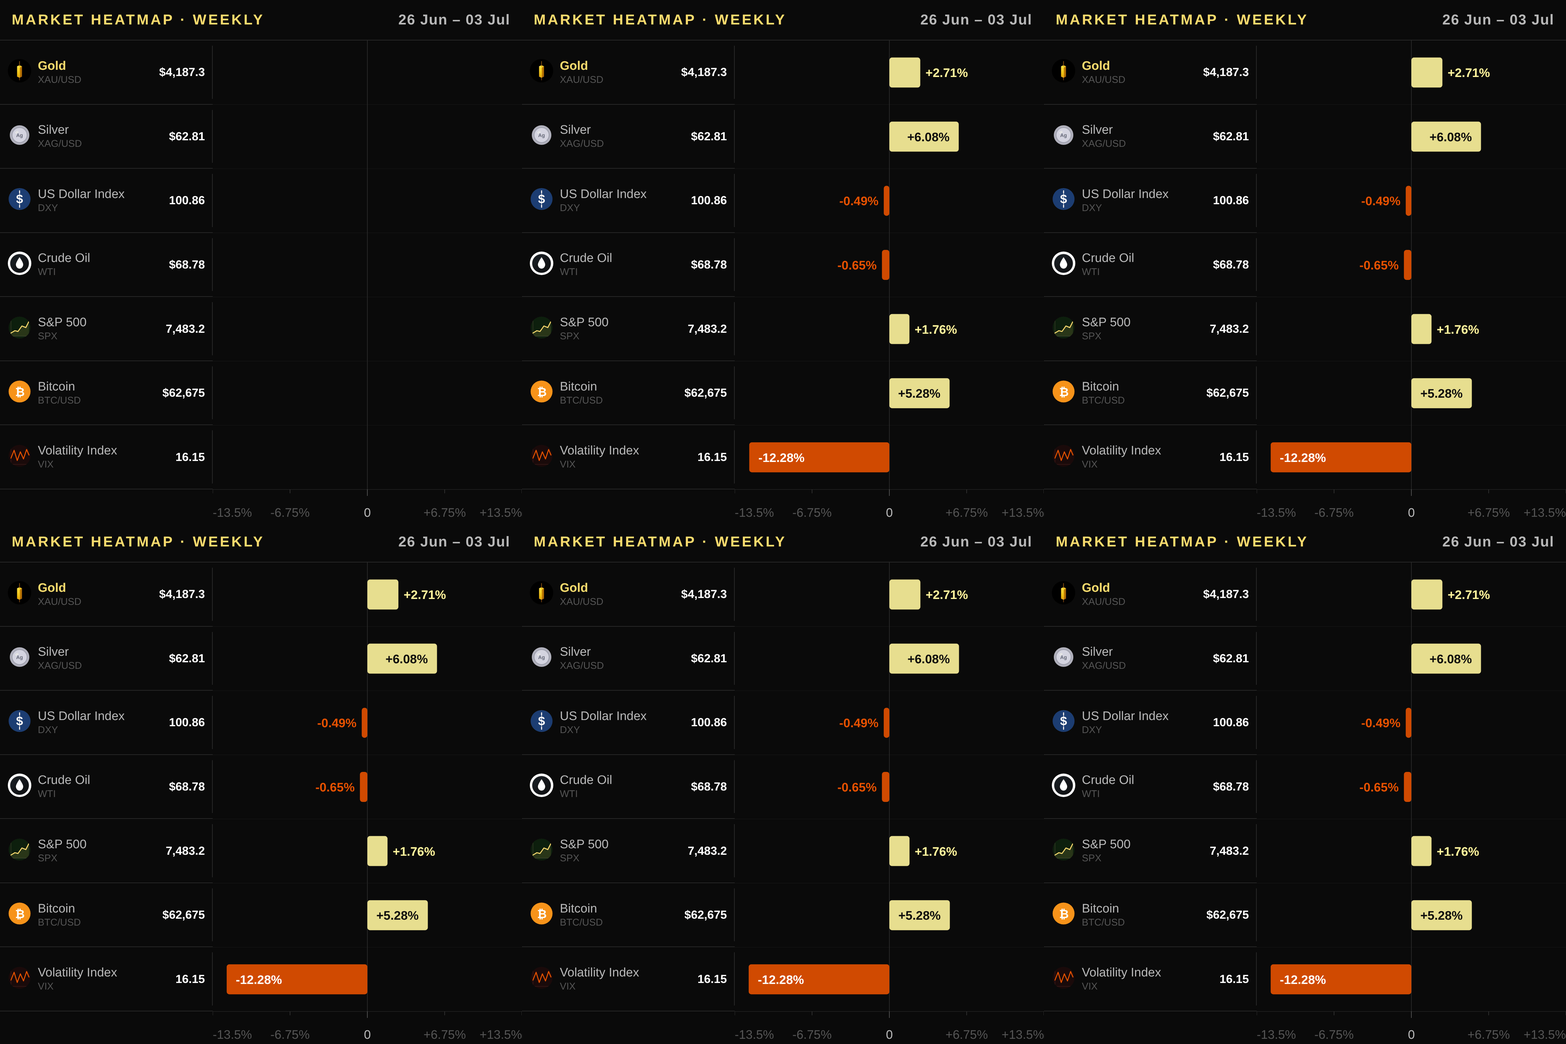
Gold's inverse relationship with the US Dollar Index (DXY) remains intact, as a weaker DXY of 100.86 supports XAU/USD demand from international buyers despite recent monthly dollar strength. The yield on US10Y at 4.47% exerts upward pressure on opportunity costs for holding non-yielding gold, yet the asset continues to attract capital when real rates moderate relative to inflation expectations of 4.27%. Copper prices have weakened monthly by 4.41%, which typically dampens industrial demand sentiment but does not necessarily invalidate safe-haven flows during periods of geopolitical stress. WTI Oil has fallen significantly over the past month at -26.07%, impacting commodity currencies like CAD while keeping inflation expectations in check for central banks globally. Silver is outperforming gold this week with a 6.08% gain but faces broader metal headwinds given its monthly decline of 14.86%. The SPX sits at 7483.24, suggesting equities are absorbing some risk premium that could otherwise flow into precious metals if market sentiment deteriorates further. Finally, Bitcoin has surged 4.22% weekly to $62,675.25; however, its recent volatility and divergence from traditional safe-haven assets like gold highlight the distinct roles each asset plays in a diversified portfolio during uncertain times.
Upcoming Catalysts
- CPI Release — 2026-07-14
- PPI Release — 2026-07-15
- GDP Report — 2026-07-30
Trading Idea
Given the strong downtrend and bearish bias, traders should consider a short position on XAU/USD with an entry zone between USD 4150–4230 (CAD 5906–5987), placing a stop loss above USD 4285 to protect against unexpected risk-off spikes near the SMA 20. The target is set at USD 4080 (CAD 5767) as gold tests support ahead of the upcoming CPI release, where continued selling pressure could drive prices lower toward the Bollinger Band lower band. Canadian investors can execute this thesis via physical holdings in Royal Canadian Mint bars and Maple Leaf coins or by shorting through inverse ETFs, while long-term holders might utilize the iShares Gold Bullion ETF (CGL.TO) to maintain exposure if they choose a more passive approach during volatile periods.
Price Outlook and FAQ
Gold is expected to trade between USD 4,058 and USD 4,316, corresponding to CAD 5,792 and CAD 6,138. Over the coming week, a neutral-to-bearish bias remains in place as price action consolidates below key resistance while macro data weighs on sentiment.
Is gold an effective inflation hedge for Canadian investors given current economic conditions? With US annual CPI at 4.27% and real yields supported by TIPS rates of 2.25%, the opportunity cost to hold non-yielding bullion remains significant despite high headline prices. For local holders, this dynamic suggests that while gold offers a store-of-value function against currency debasement over time, short-term purchasing power erosion may limit its hedge efficacy until real interest rates decline further or inflation expectations decelerate more sharply than current data implies.
How do Bank of Canada and Federal Reserve rate decisions influence the price of gold denominated in Canadian dollars? The CAD/USD exchange rate acts as a transmission mechanism where a stronger US dollar driven by Fed policy tightens global liquidity, pushing down local prices even if domestic BoC rates stay steady at 2.25%. Since the loonie often strengthens when oil and metals remain resilient while real TIPS yields rise, Canadian investors must watch both central bank differentials to gauge whether their CAD-denominated holdings are appreciating due to currency flows or fundamental demand for a non-yielding asset.
What are the primary ways Canadian residents can acquire physical gold without selling existing assets? Investors looking for direct exposure should consider acquiring Royal Canadian Mint bars and Maple Leaf coins from accredited dealers, which offer tax-deferred growth potential within registered accounts if structured correctly. Alternatively, those preferring liquidity may utilize exchange-traded products like the iShares Gold Bullion ETF (CGL.TO) or the Sprott Physical Gold Trust (PHYS), both listed on the Toronto Stock Exchange to facilitate easy trading without storage complications.
This article is for informational purposes only and does not constitute investment advice or a financial recommendation. Investing in financial assets involves risk.
Key Takeaways for Traders
- Market Stance: Given the strong downtrend confirmed by price trading below all major moving averages and a negative MACD histogram, traders should maintain a bearish stance with entries only on confirmed breakouts above resistance; current momentum suggests further downside potential near the 60-day low support zone before any meaningful reversal can occur.
- Key Technical Level: The primary level to watch this week is the $4187 USD / CAD 5,930 resistance acting as immediate overhead pressure while the SMA 20 at $4162 USD serves as dynamic intraday support that could turn into a stop-loss trigger if broken decisively.
- Macro Driver: Monitor upcoming US CPI data on July 14 closely for inflation surprises that could accelerate Fed hawkishness, which would lift real rates and increase the opportunity cost of holding gold as a non-yielding asset in this environment.
- Flow Signal: The persistent ETF outflows totaling nearly $2 billion recently contradict bullish COT positioning from speculative managers, indicating institutional investors are reducing allocations while hedge funds remain net long; central bank buying has slowed to a secondary role compared to these powerful retail and fund flows driving prices lower.
- Risk Consideration: A sudden spike in geopolitical tensions could temporarily decouple gold from technical levels as safe-haven demand surges regardless of real rates, though traders should prepare for increased volatility around VIX readings above 20 that often signal short-covering rallies rather than sustained trend reversals.
