Market Bias
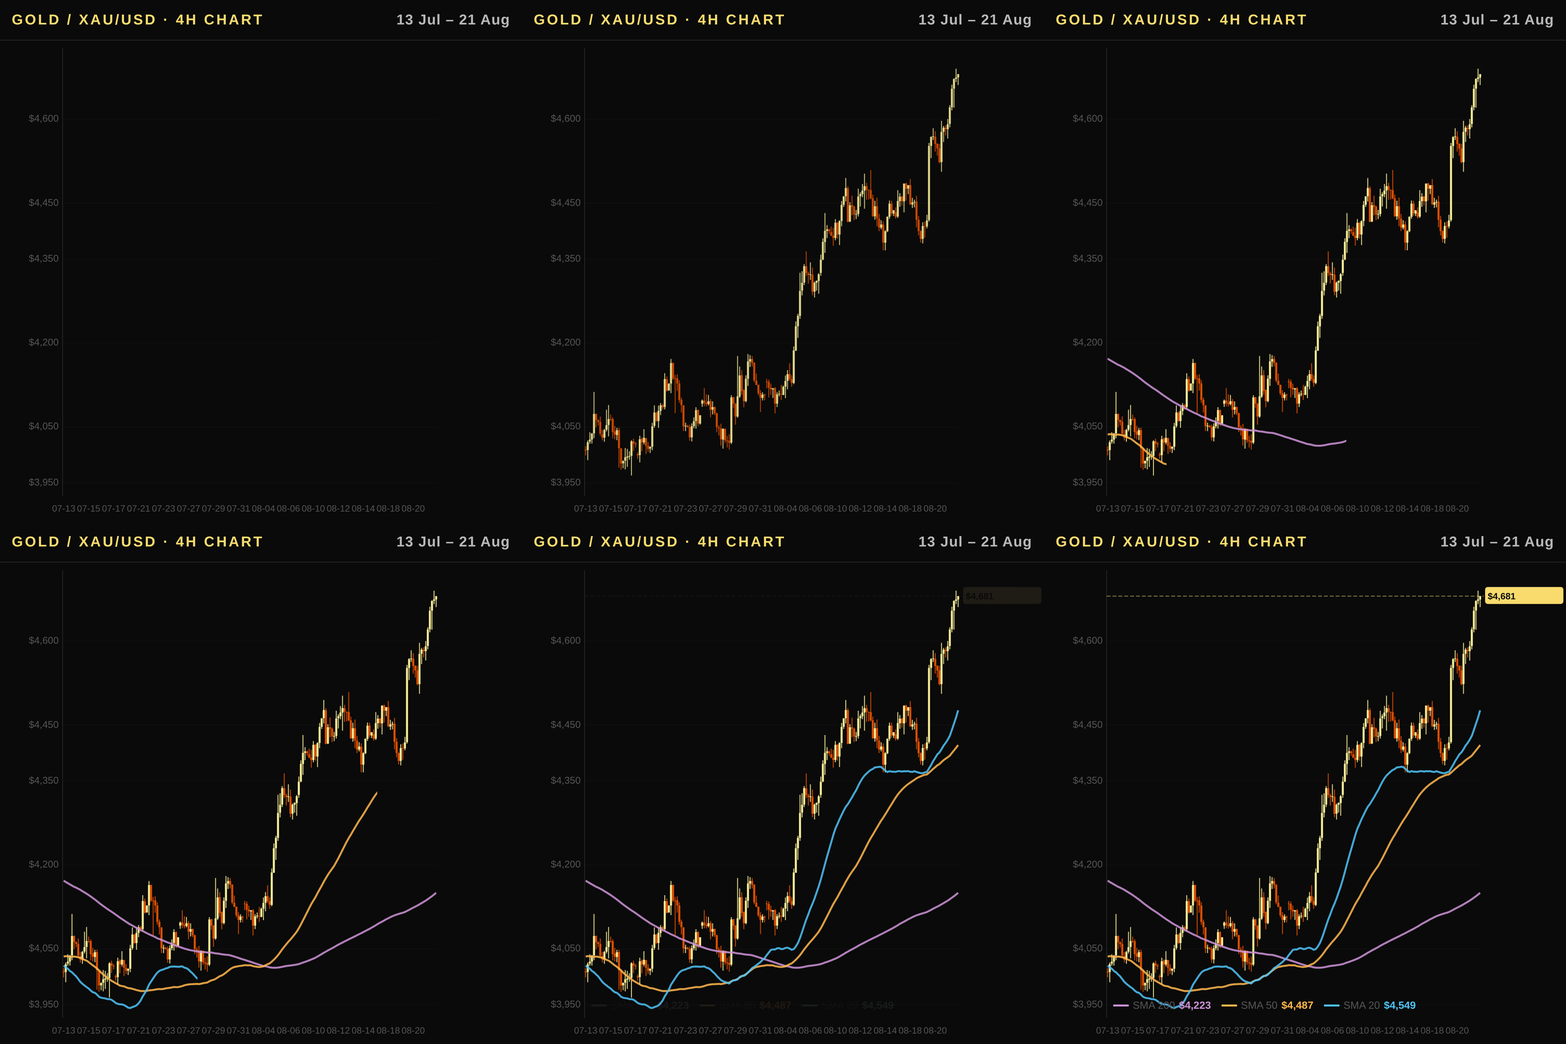
Bullish. Gold is firmly in a strong uptrend, trading above all key moving averages with the MACD histogram positive at 34.03 confirming bullish momentum. The asset recently tested its 60-day high resistance at $4624.1 and continues to rally as safe-haven demand supports prices alongside structural tailwinds like central bank buying and ETF inflows.
Executive Summary
The gold price today is trading at $4,624.10 in USD, which equates to approximately 6,449 AUD per ounce, reflecting a significant weekly gain of 5.56% as the asset consolidates its strong uptrend. This gold analysis highlights that while real interest rates remain supportive for the non-yielding metal at 2.35%, recent ETF inflows of nearly $3 billion and rising central bank demand continue to underpin the bullish sentiment globally. Australian investors should monitor the strengthening Aussie dollar, which has gained 2.15% against the US dollar over the last month, as a key factor influencing local gold prices alongside global XAU/USD dynamics.
Australia Outlook: RBA Policy, the Aussie Dollar, and Gold in AUD
- Gold Pricing Mechanism: Australian investors buy gold priced in AUD, meaning the local gold price rises when the AUD weakens against the USD and falls when the AUD strengthens. The current USD/AUD rate is 1.3946, and the Aussie has strengthened over the last month with a -2.15% change in the exchange rate data, which exerts downward pressure on the local gold price despite strong underlying demand.
- Commodity Currency Dynamics: The Australian dollar acts as a commodity currency correlated with oil and metals prices, often moving with the global risk cycle. WTI oil has risen 5.66% this week, providing a bullish undercurrent for the AUD — and a firmer Aussie dollar lowers the AUD gold price even when USD prices hold up.
- RBA Policy Context: The Reserve Bank of Australia sets policy independently, currently maintaining its rate at 4.35%, while focusing on its 2% inflation target. The RBA–Fed rate differential remains a key driver of the USD/AUD pair, with the Fed funds rate at 3.63%.
- Domestic Economic Fundamentals: Recent Australian data shows annual CPI at 2.9% and GDP growth of 1.4%, providing a stable backdrop for central bank decision-making that prioritizes price stability over aggressive tightening in this soft-landing environment.
Technical Analysis
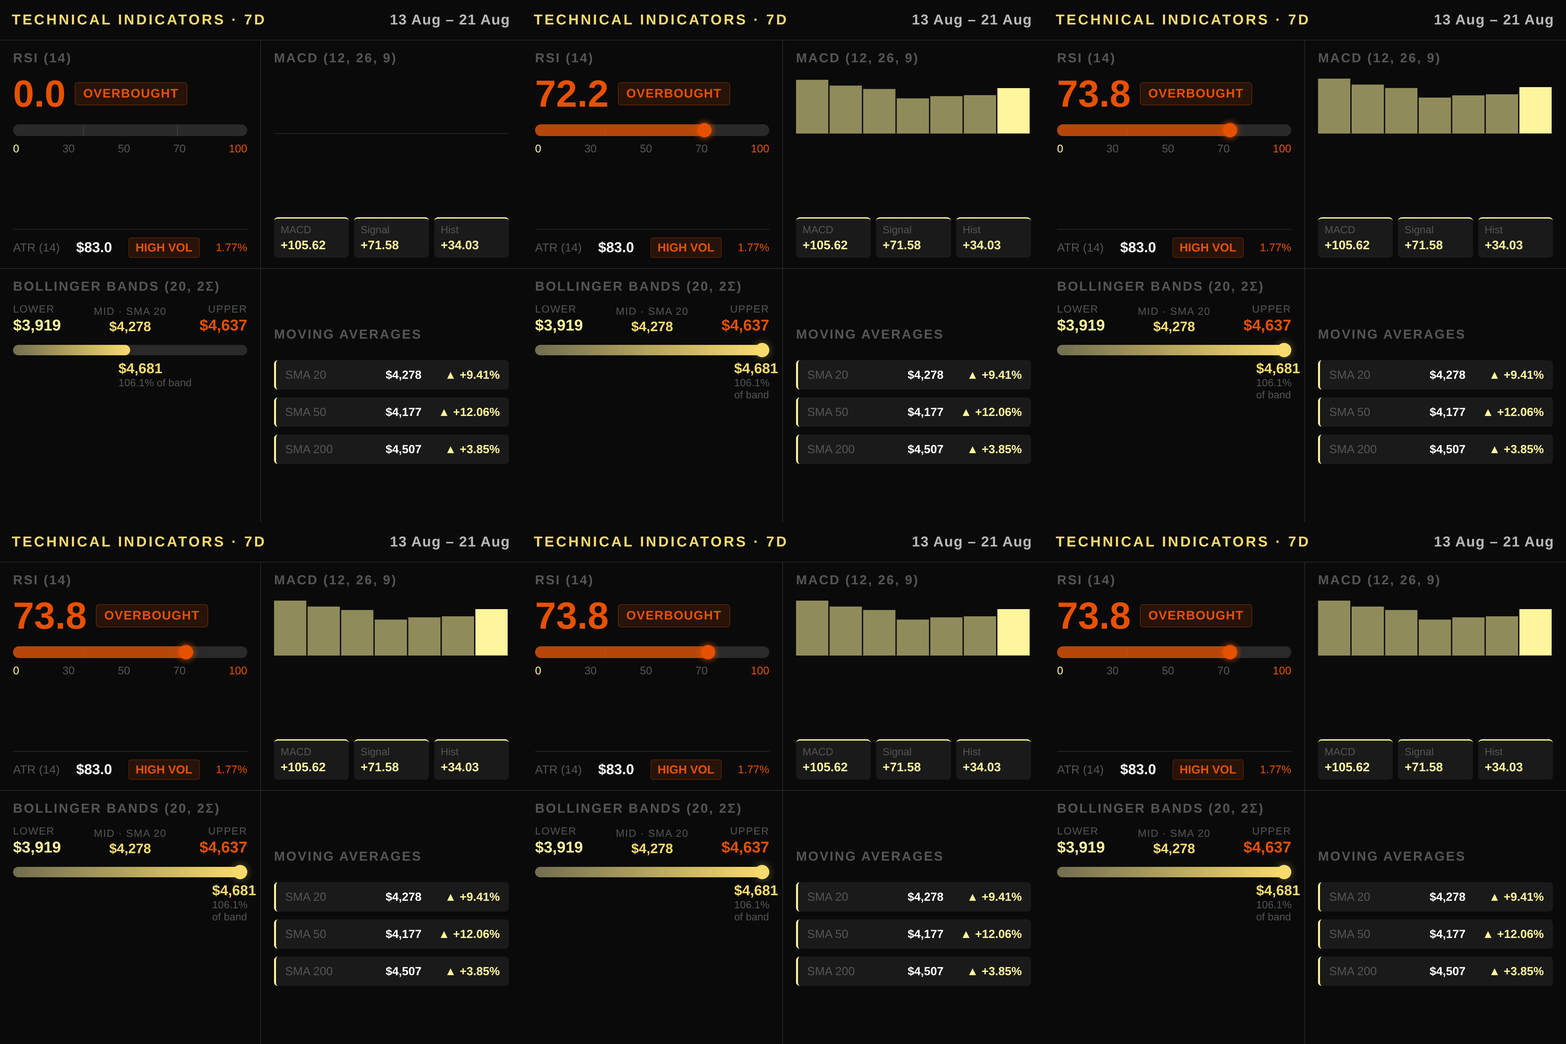
Gold price today in Australia is trading at $4,624.10 USD, which sits just below the 60-day resistance level but firmly above all major moving averages. The daily chart shows a strong uptrend with the current price well above the 50-day simple moving average (SMA 50) of $4,177.00 and the 200-day SMA (SMA 200) at $4,507.00. Price action is holding comfortably above the 20-day moving average (SMA 20) of $4,278.20, which now acts as dynamic support rather than resistance. The immediate overhead barrier remains the upper Bollinger Band at $4,637.00, with the 60-day high coinciding closely at $4,624.10.
Momentum indicators confirm bullish strength in the XAU/USD market. The Relative Strength Index (RSI) reads 73.8, indicating the asset is in overbought territory but still within a valid uptrend channel. A MACD histogram value of 34.03 suggests strengthening bullish momentum despite the broader trend, while the MACD line at 105.62 sits above its signal line at 71.59. Volatility is moderate with an Average True Range (ATR) of 83.0, implying typical daily fluctuations around this level are normal for the current market regime.
For Australian investors tracking the local price, the $4,624.10 USD spot converts to approximately $6,449 AUD/oz. The 60-day support zone sits at $3,962.50 USD (roughly $5,530 AUD), representing a key floor for the local asset class. Conversely, breaking above the $4,637.00 upper Bollinger Band would signal a continuation of the rally toward the 52-week high near $5,586.20.
Macroeconomic Factors
The Federal Reserve maintains its funds rate at 3.63%, while the 10-year Treasury yield sits at 4.6% with a real rate of 2.35% as measured by TIPS. The upward-sloping yield curve, reflected in a positive 10Y-2Y spread of 0.5%, reinforces an environment where higher opportunity costs generally weigh on gold’s non-yielding asset appeal. The US Dollar Index (DXY) fell -0.87% on the week and -2.59% on the month; this softening dollar lowers the effective price for foreign buyers and supports global demand for XAU/USD. While the 10-year yield has risen slightly to 4.6%, the real rate remains elevated at 2.35%, creating a persistent headwind that gold must overcome through safe-haven flows or geopolitical tension. Geopolitical volatility in the Middle East provides a risk-off premium that temporarily offsets the drag from strong real yields, keeping institutional interest intact despite the Fed’s restrictive stance.
Positioning and Market Flows
The latest CFTC Commitment of Traders (COT) report reveals a robust speculative bias toward gold, with non-commercial net long contracts reaching 222,189. This positioning signals strong institutional bullishness as large hedge funds have accumulated significant positions in XAU futures, reinforcing the current upward momentum despite broader equity volatility.
Institutional flows through exchange-traded funds have turned decisively positive this month, recording a net inflow of approximately $2.97 billion. These substantial purchases indicate a surge in demand from asset managers and retail investors seeking safety ahead of geopolitical risks, effectively offsetting any previous selling pressure seen in earlier quarters.
Central bank demand continues to provide a structural floor for prices, with global reserves rising steadily over the past year. This steady accumulation by official sector entities acts as a buffer against speculative volatility, ensuring that gold remains attractive even when real yields remain elevated.
Correlated Assets
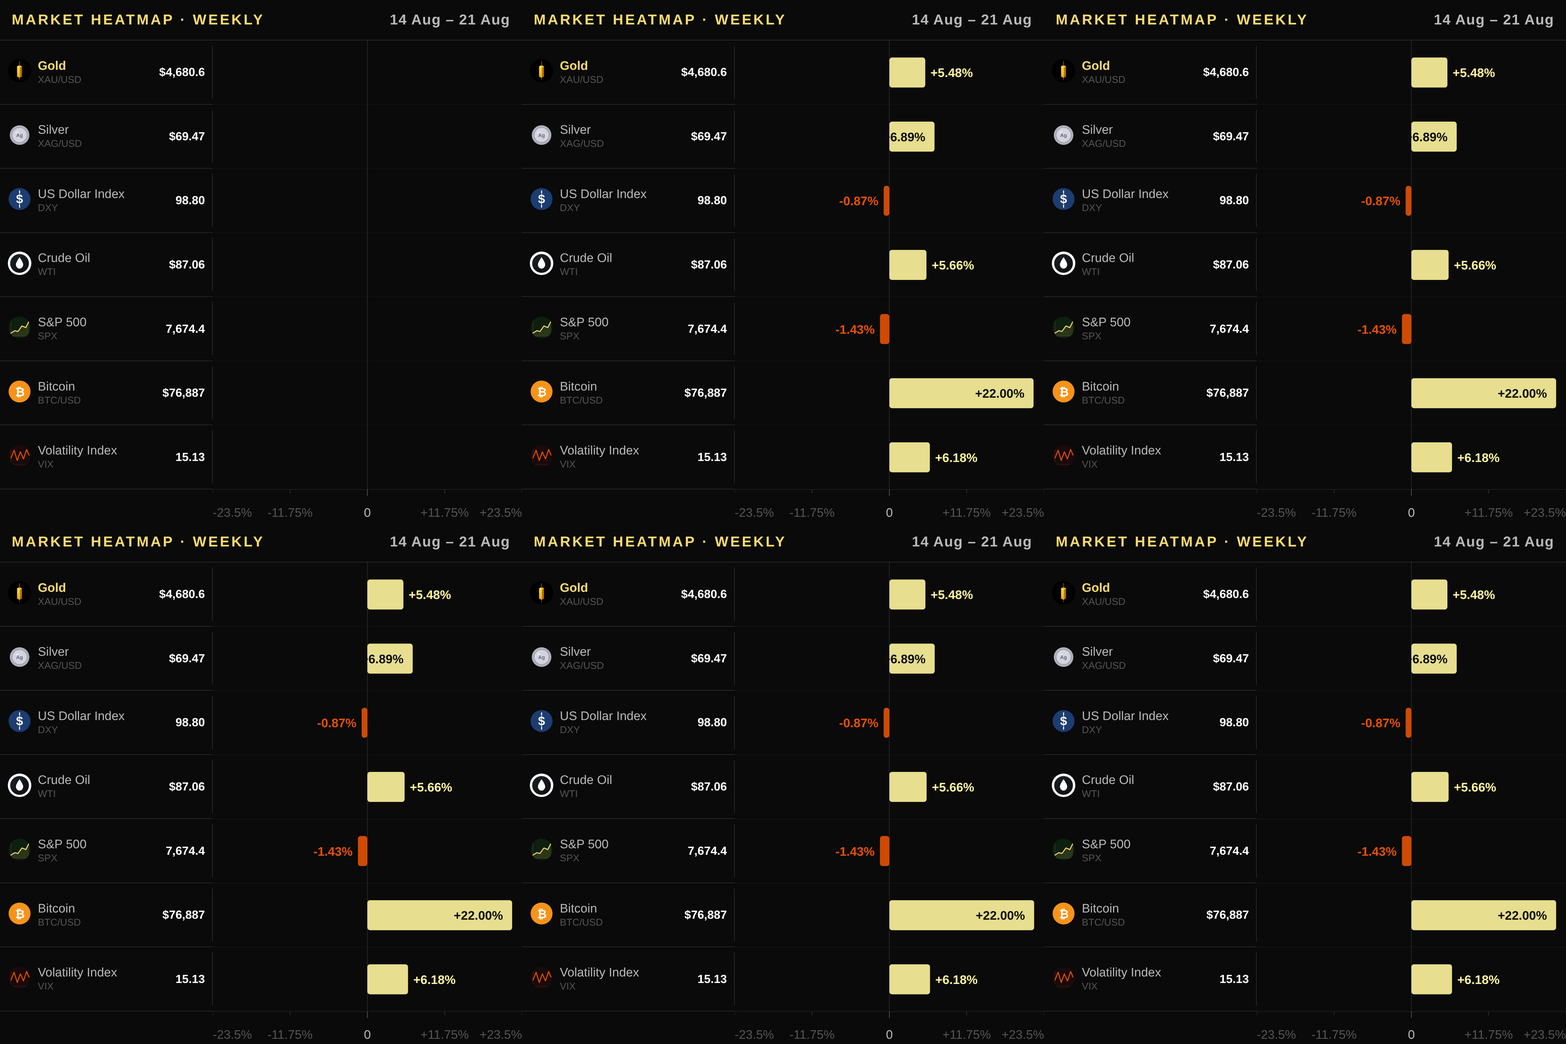
The US Dollar Index (DXY) has slipped to 98.8, marking a weekly decline of -0.87% that supports higher gold prices by easing demand costs for international buyers. Conversely, the 10-year Treasury yield rose to 4.738%, reflecting tighter financing conditions that generally weigh on non-yielding assets like XAU/USD. Silver has rallied strongly, with its price jumping 6.89% this week and surging 20.19% over the month, aligning closely with gold's recent momentum. WTI oil prices advanced 5.66% weekly, reinforcing the commodity currency nature of the Australian dollar while adding a geopolitical risk premium to safe-haven demand. Copper futures edged down slightly at $6.5795 per pound this week despite a monthly gain of 4.35%, indicating mixed industrial sentiment. The S&P 500 posted a weekly loss of -1.43% but remains up 3.59% over the past month, showing equities are not yet in a bearish regime that would trigger broad flight to safety. The VIX volatility index climbed 6.18% weekly, suggesting investors remain sensitive to geopolitical shocks that could abruptly shift sentiment toward gold regardless of real rates. Bitcoin remains elevated at $76,887 with a weekly change of +19.19%, though it should not be conflated with traditional safe-haven assets given its distinct risk profile.
Upcoming Catalysts
- US Gross Domestic Product — 2026-08-26: A key gauge of global economic health that influences growth expectations and Fed policy, which in turn impacts real rates and gold demand.
- US Non-Farm Payrolls — 2026-09-04: Major labor market data release that shapes interest rate expectations and the strength of the US dollar, directly affecting XAU/USD sentiment.
- US Producer Price Index — 2026-09-10: An early indicator of inflation trends that could alter central bank policy stances or influence the yield curve's shape.
- US Consumer Price Index — 2026-09-11: The definitive measure of consumer inflation, with outcomes driving expectations for the Fed’s path and real yields, both critical drivers for gold prices.
Trading Idea
Given the strong uptrend with gold trading well above all major moving averages, the primary bias remains bullish for a long position in XAU/USD. Traders should look to enter near USD 4,620–4,650 (AUD 6,450–6,495), placing a stop loss below USD 4,500 (AUD 6,276) to protect against a breakdown of the SMA 200 support at USD 4,507.0. A realistic first target is USD 4,750 (AUD 6,617), aligned with the extension of the current weekly advance and potential breakout above the 60-day resistance. Australian investors can implement this view by holding shares in the Global X Physical Gold ETF (GOLD.AX) or Perth Mint Gold ETF (PMGOLD.AX) on the ASX, or by purchasing physical gold via Perth Mint bars and Kangaroo coins from local bullion dealers.
Price Outlook and FAQ
Gold is expected to trade between $4,560 and $4,710 USD tomorrow, corresponding to a range of AUD 6,362 to AUD 6,575. The one-week bias remains bullish as the metal consolidates near its recent weekly high ahead of key US data.
Is gold currently an effective inflation hedge for Australian investors given the CPI environment? Yes, gold continues to serve as a robust inflation hedge despite the current US CPI reading of 3.54%, particularly when real yields remain elevated. While the 10Y Real Rate (TIPS) stands at 2.35% which creates some opportunity cost, gold's non-yielding status protects purchasing power better than cash or bonds in an inflationary regime.
How do Reserve Bank of Australia and Fed rate decisions impact gold prices in AUD? The RBA policy rate of 4.35% versus the Fed Funds Rate of 3.63% creates a narrowing differential that has supported the Australian dollar, which is currently strengthening against the USD. This stronger local currency exerts downward pressure on the AUD-gold price, meaning investors should monitor US interest rate paths closely as they drive the exchange rate mechanism.
How can Australian investors best buy gold for their portfolio? Australian investors have two primary avenues: exchange-traded products like the Global X Physical Gold ETF (GOLD.AX) and the Perth Mint Gold ETF (PMGOLD.AX) listed on the ASX, or physical assets such as Perth Mint bars and Kangaroo coins from licensed bullion dealers. These options offer liquidity for funds while providing direct exposure to the asset class without significant storage fees associated with private vaulting.
This article is for informational purposes only and does not constitute investment advice or a financial recommendation. Investing in financial assets involves risk.
Key Takeaways for Traders
- Market Stance: The market remains strongly bullish as the price trades well above the SMA20 and SMA50, supported by a robust positive MACD histogram; traders should look to enter long positions near current levels while acknowledging the asset is approaching upper Bollinger Band resistance.
- Key Technical Level: Watch the $4637.0 upper Bollinger Band closely this week as a potential pivot point where momentum could stall or reverse if price fails to break through with conviction.
- Macro Driver: Monitor the US 10Y Real Rate (TIPS) at 2.35% and the Fed Funds Rate at 3.63%, as a decline in real rates from here would be the primary fundamental catalyst to extend this gold rally.
- Flow Signal: Institutional inflows remain strong with a monthly ETF flow of $2.97 billion into holdings, confirming that retail speculation is backed by genuine capital seeking safe-haven exposure.
- Risk Consideration: A sudden surge in the US Dollar Index or a sharp spike in the 10Y Treasury yield could trigger a short-term correction as the asset's non-yielding nature becomes more costly against higher real interest rates.
