Market Bias
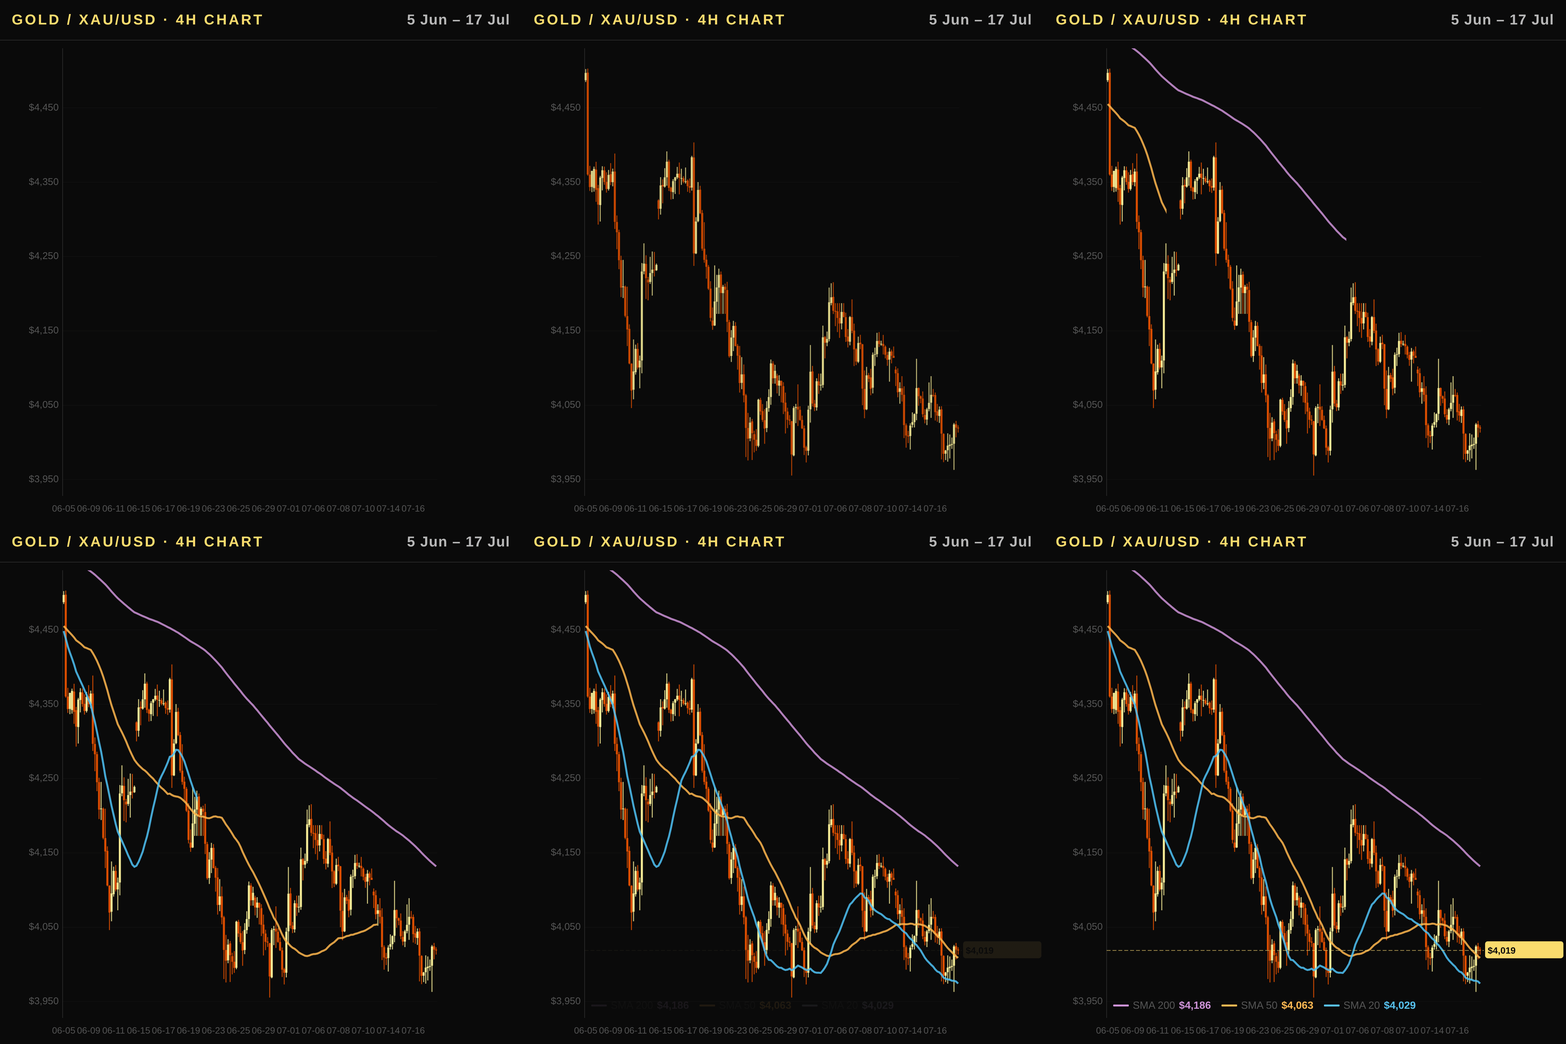
Bearish. Gold is trading well below all key moving averages, with price action confirming a strong downtrend as real rates rise and ETF outflows persist despite geopolitical headlines providing temporary support.
Executive Summary
The gold price today in Australia (AUD) is trading at 5,744 AUD/oz alongside a USD equivalent of $4012.7 per ounce as XAU/USD analysis points to a strong downtrend with the weekly change down -2.23%. Current market data shows significant outflows from gold ETFs totaling approximately $9.18 billion in June, which acts as a bearish counterweight despite central bank buying that has supported prices for years. Investors should note that real interest rates remain elevated at 2.35% according to TIPS yields, creating an opportunity cost disadvantage for this non-yielding asset while the US Dollar Index holds firm near 100.75.
Australia Outlook: RBA Policy, the Aussie Dollar, and Gold in AUD
- Gold Pricing Dynamics: Australian investors buy gold priced locally in AUD; when the currency weakens against the USD, the local price rises for domestic holders, while a strengthening AUD causes the AUD-denominated price to fall.
- Currency Correlation: The AUD is a commodity-linked asset that often moves with global risk sentiment and oil prices, where WTI crude has surged 15.52% weekly despite gold's recent decline.
- Monetary Policy Context: The Reserve Bank of Australia sets its own policy independent of the Fed but focuses on its 2% inflation target, maintaining a rate differential that influences USD/AUD flows alongside global capital movements.
- Economic Backdrop: Domestic economic context shows annual CPI at 2.9%, with GDP growth recorded at 1.4%, providing stability for local investors navigating currency volatility against the backdrop of rising real US interest rates.
Technical Analysis
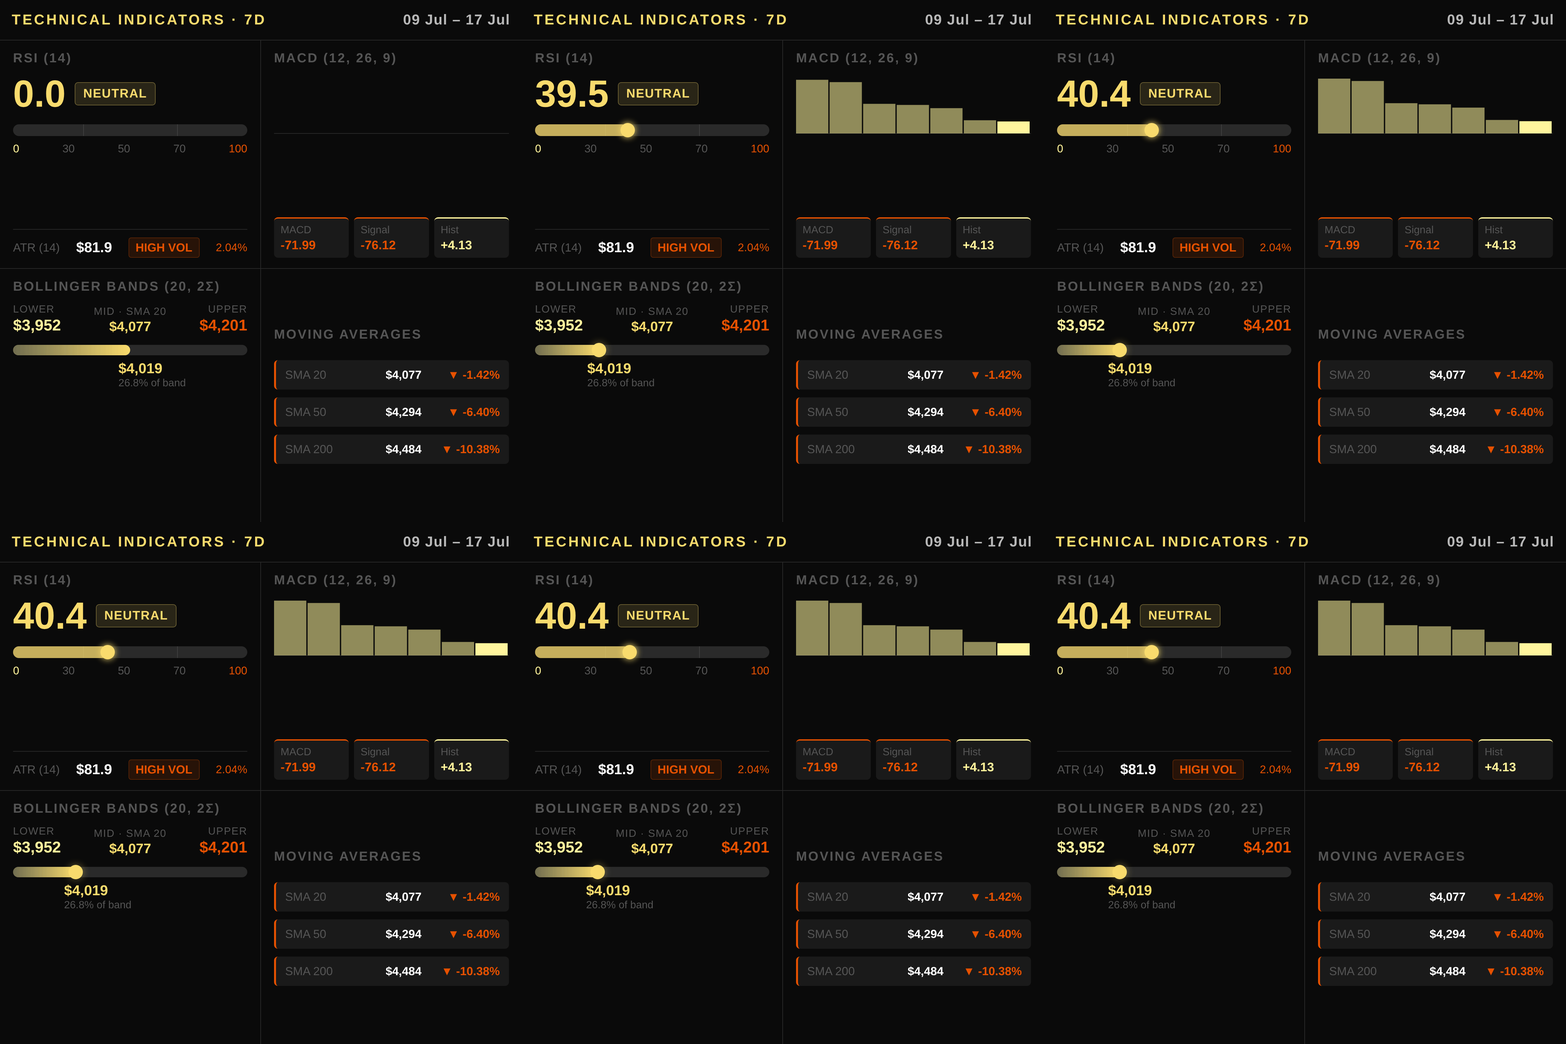
Gold is currently trading at $4012.7 in USD, firmly below all key moving averages including the 50-day average of $4293.6 and the longer-term SMA 200 at $4484.1, confirming a strong downtrend structure that aligns with our bearish market bias. The price also sits just above its immediate support near $3962.5, while resistance is capped by the 60-day high at $4765.2. Technical momentum remains weak as measured by an RSI of 40.4, which places gold below the neutral level of 50 and indicates bearish pressure without yet reaching oversold territory. The MACD line sits at -71.99 against a signal line of -76.12, generating a small positive histogram reading of +4.13; this suggests downside momentum is slowing slightly but the overall trend remains negative. Volatility has contracted into Bollinger Bands with the 20-period upper band at $4201.1, the middle band coinciding with the SMA 20 at $4076.6, and the lower channel near $3952.0. The Average True Range (ATR) of 81.9 reflects moderate intraday volatility that should be factored into stop-loss placement for any short positions targeting downside from current levels.
Macroeconomic Factors
The Federal Reserve maintains a funds rate of 3.63%, while the 10-year Treasury yield sits at 4.47%, with real yields measured by TIPS at 2.35% and rising, which elevates opportunity costs for non-yielding gold. A strengthening US Dollar Index (DXY) recently ticked up to 100.75 on a monthly basis of 1.22%, pressuring the metal as higher real rates diminish its appeal relative to income-generating assets. The yield curve remains normal with a positive spread between the 10-year and 2-year notes at 0.37%, signaling no immediate recession risk but limiting aggressive rate-cut speculation that could support gold prices. Geopolitical tensions continue to provide a safe-haven premium, as seen in elevated VIX readings of 18.77 with weekly gains exceeding 24%, yet these drivers are partially offset by the broader macro headwinds from sustained inflation at 3.73% YoY and firming real rates that keep gold under pressure despite its historic resilience during uncertain times.
Positioning and Market Flows
The latest CFTC report reveals a net speculative long position of 186,682 contracts in XAU futures, reflecting continued bullish sentiment from non-commercial traders who are accumulating positions as price volatility persists. This structural accumulation contrasts sharply with the commercial sector's heavy short stance of -214,788 contracts, which primarily serves to hedge physical production rather than signal market direction.
Despite this underlying speculative strength, Gold ETF holdings have contracted by 76.5 tonnes in June alone, translating into a net outflow exceeding $9 billion. This massive selling pressure indicates that institutional investors are actively reducing their paper gold exposure, creating friction between futures accumulation and actual share-based demand from the broader investment public.
Central bank buying continues to provide a critical floor for prices, acting as an independent source of structural support distinct from speculative positioning or ETF flows. These sovereign purchases decouple price action from pure market sentiment, ensuring that downside moves are often arrested by official sector demand regardless of short-term technical weakness in futures markets.
Correlated Assets
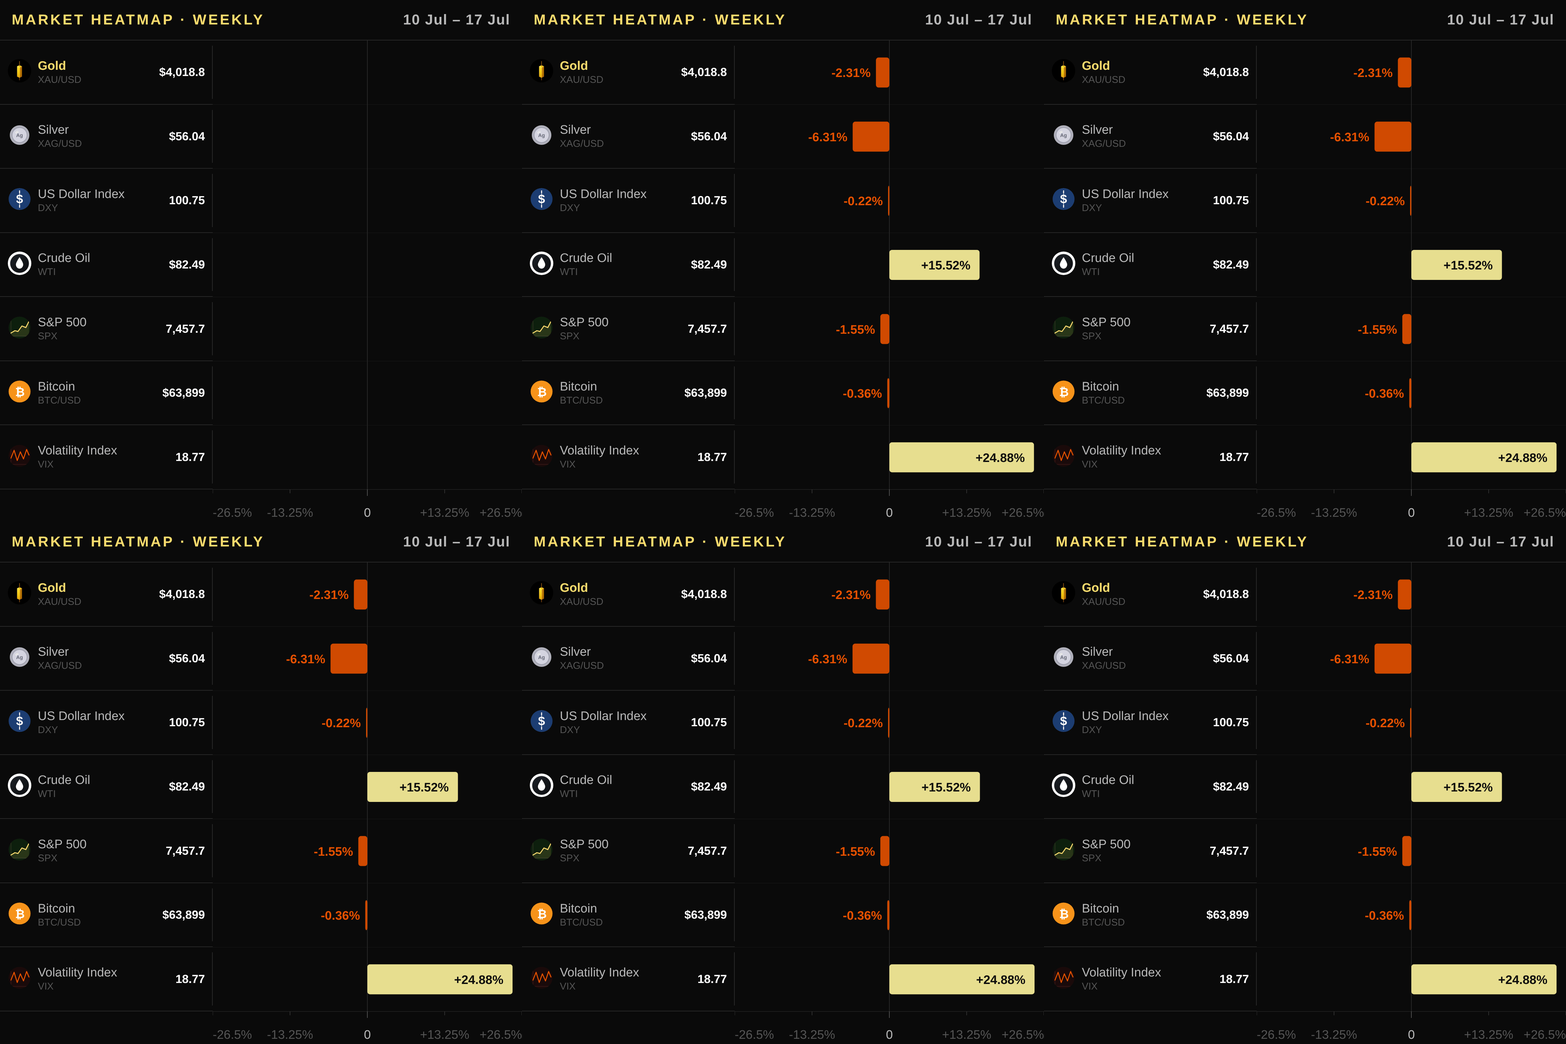
Gold's inverse relationship with DXY remains intact, as the US Dollar Index sits at 100.75 but has weakened slightly by -0.22% weekly, providing a modest tailwind for XAU/USD even though it rose +1.22% monthly. The yield curve is normal and upward-sloping with a positive 10Y-2Y spread of 0.37%, while the US10Y at 4.541% exerts ongoing pressure on real rates as they climb to 2.35%. Real interest rate increases raise opportunity costs for holding non-yielding gold, acting as a significant headwind alongside ETF outflows totaling $-9,186 million in June. Silver mirrors the broader precious metal trend at USD 56.03, down -6.31% weekly and -15.42% monthly, confirming sector-wide weakness rather than isolated underperformance. Industrial metals like copper show mixed signals with prices falling to $6.22/lb this week as demand concerns persist despite WTI oil climbing sharply by +15.52%. The volatility index VIX surges +24.88% weekly, indicating rising fear that typically supports safe-haven flows even if higher yields suppress the trend over time. Bitcoin trades at USD 64,148 with a +3.07% weekly gain but remains structurally distinct from gold as it lacks intrinsic value or central bank support. Equity markets including SPX decline -1.55% weekly while bond yields rise, creating an environment where capital allocation decisions between equities and commodities become increasingly critical for risk-adjusted returns.
Upcoming Catalysts
- US Gross Domestic Product — 2026-07-30: The release could alter expectations for Fed policy, influencing gold as investors weigh real rates and growth dynamics.
- US Non-Farm Payrolls — 2026-08-07: A strong jobs report may push the dollar higher or support a hawkish rate stance, creating headwinds for XAU/USD in this downtrend context.
- US Consumer Price Index — 2026-08-12: Fresh inflation data will directly impact real TIPS yields and Fed guidance, which are primary drivers of gold’s short-term direction today.
- US Producer Price Index — 2026-08-13: This monthly gauge offers early insight into cost pressures that could precede a shift in consumer prices, affecting market sentiment ahead of the next CPI print.
Trading Idea
The bias remains bearish, so investors should consider a short position targeting lower gold prices in XAU/USD with an entry zone between USD 3980–4050 (AUD 5,701–5,801). Place your stop loss above the SMA 20 at USD 4110 (AUD 5,887) to protect against a technical rebound that could invalidate the downtrend structure. Set your profit target near the recent support level of USD 3960 (AUD 5,672), where downside momentum may accelerate given the lack of bullish volume confirmation in futures markets. Australian investors can execute this directional view by holding short positions through derivatives or implementing a hedged stance via physical gold purchases and sales using Perth Mint bars or Kangaroo coins available at local bullion dealers.
Price Outlook and FAQ
Tomorrow's expected range is USD 3,985–4,050 (AUD 5,708–5,801), with a one-week directional bias of bearish toward the support zone near $3,962.5 as price remains below key moving averages.
Is gold currently an effective inflation hedge for Australian investors given recent CPI data? Yes, although real yields have risen slightly to 2.35%, which increases opportunity costs for this non-yielding asset, gold still offers protection against persistent consumer price pressures like the current 3.73% annual US CPI and domestic 2.9% inflation in Australia by preserving purchasing power when fiat currencies erode over time.
How do Reserve Bank of Australia rate decisions versus Federal Funds Rate moves impact gold prices in AUD? The RBA maintains a policy rate of 4.35%, creating a slight divergence with the Fed's current 3.63% stance, but it is primarily real rates—specifically the TIPS yield—that dictate global demand; furthermore, the Aussie has been broadly stable against the USD (+0.77% over 30 days), so were it to strengthen from here, local gold prices would fall even if the metal holds value globally.
What are the best ways for investors on the ASX to acquire physical or ETF-backed exposure? Australian residents can access exchange-traded products such as the Global X Physical Gold ETF (GOLD.AX) and Perth Mint Gold ETF (PMGOLD.AX), while those preferring tangible assets may purchase official Perth Mint gold bars and Kangaroo coins directly from licensed Australian bullion dealers.
This article is for informational purposes only and does not constitute investment advice or a financial recommendation. Investing in financial assets involves risk.
Key Takeaways for Traders
- Bearish Bias: The market stance is Bearish as XAU/USD trades below all key moving averages with a -2.23% weekly decline; the downtrend stays intact unless price reclaims the SMA 20 at USD 4,076.6 on a sustained close.
- Key Resistance Level: Watch the 60-day high at USD $4,765.2 (AUD 6,825) as the major overhead resistance that must be breached to invalidate the current downtrend structure.
- Real Rates Monitor: Keep a close eye on rising TIPS yields of 2.35% which increase the opportunity cost for holding non-yielding gold and suppress price momentum in USD terms.
- ETF Outflow Signal: Large institutional selling pressure is evident with monthly flows at -$9,186 million, indicating significant capital rotation out of exchange-traded funds despite some speculative futures long positioning.
- Volatility Hedge Risk: The elevated ATR reading of 81.9 combined with a VIX spike suggests traders should use tight stops and consider hedging portfolios against further downside if geopolitical tensions escalate unexpectedly.
