Market Bias
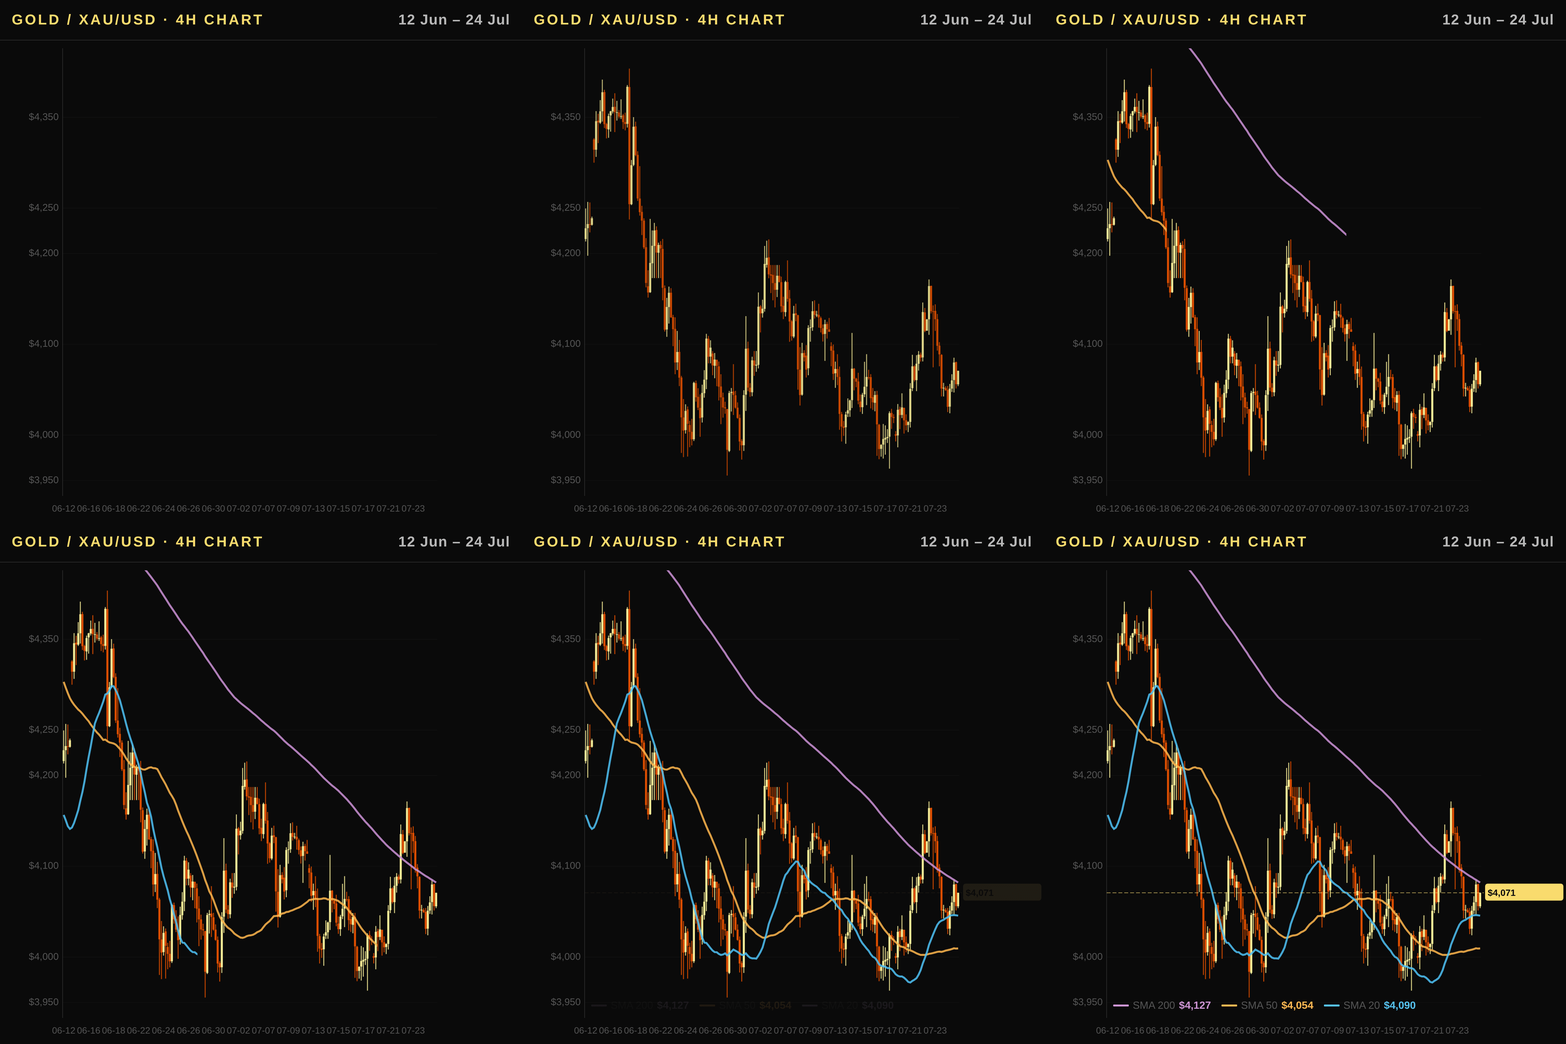
Bearish. The current price of $4,067.6 is trading below all major moving averages (SMA 20 at $4,073.1, SMA 50 at $4,233.9, and SMA 200 at $4,486.4), confirming a strong downtrend that outweighs recent weekly gains of 1.37%. While the MACD histogram shows minor easing momentum with a value of +14.71 against a negative line of -46.79, price remains beneath critical resistance levels and below the neutral RSI reading of 46.2.
Executive Summary
The gold price today in Australia (AUD) is trading at 5,808 AUD/oz as strong technical downtrends persist despite a recent weekly rally of 1.37%. In USD terms, spot XAU/USD sits near $4,067, well below the key resistance zone around $4,234 and under pressure from rising real yields anchored at 2.43%. The primary driver for this gold analysis is a bearish bias as price remains trapped beneath critical moving averages while ETF outflows of roughly $9.19 billion over the past month signal institutional caution. Australian investors should note that local demand faces headwinds from a strengthening Aussie dollar, which has fallen 0.63% weekly against the greenback, further dampening sentiment in this non-yielding asset class.
Australia Outlook: RBA Policy, the Aussie Dollar, and Gold in AUD
- Australian investors buy gold priced locally; a weaker AUD amplifies the gold price today for domestic holders while a stronger AUD dampens it. The current AUD/USD rate is 1.4319, having weakened by -1.22% over the last month as USD strength persists in global markets.
- As a commodity currency linked to oil and metals prices, the Aussie dollar often tracks the risk cycle; with WTI crude rising sharply weekly (+8.27%) this year, the AUD has faced headwinds from strong US yields but remains sensitive to global growth expectations that support metal demand.
- The Reserve Bank of Australia maintains its policy rate at 4.35%, having hiked since May as it pursues its inflation target; while the Fed funds rate sits lower now at 3.63% after cuts, this narrowing differential has helped buoy the AUD against a backdrop where higher US real rates (10Y TIPS yield of 2.43%) typically pressure gold yields negatively in USD terms but less so for local buyers when their currency depreciates alongside it.
- Domestic inflation remains contained at an annual rate of 2.9%, below the Fed’s headline CPI reading, while GDP growth has been modest yet positive at 1.4% last year; these fundamentals provide a stable backdrop where gold acts as both an alternative store of value and a hedge against potential policy divergence between Sydney and Washington regarding future rate paths that could alter AUD/USD flows further this quarter.
Technical Analysis
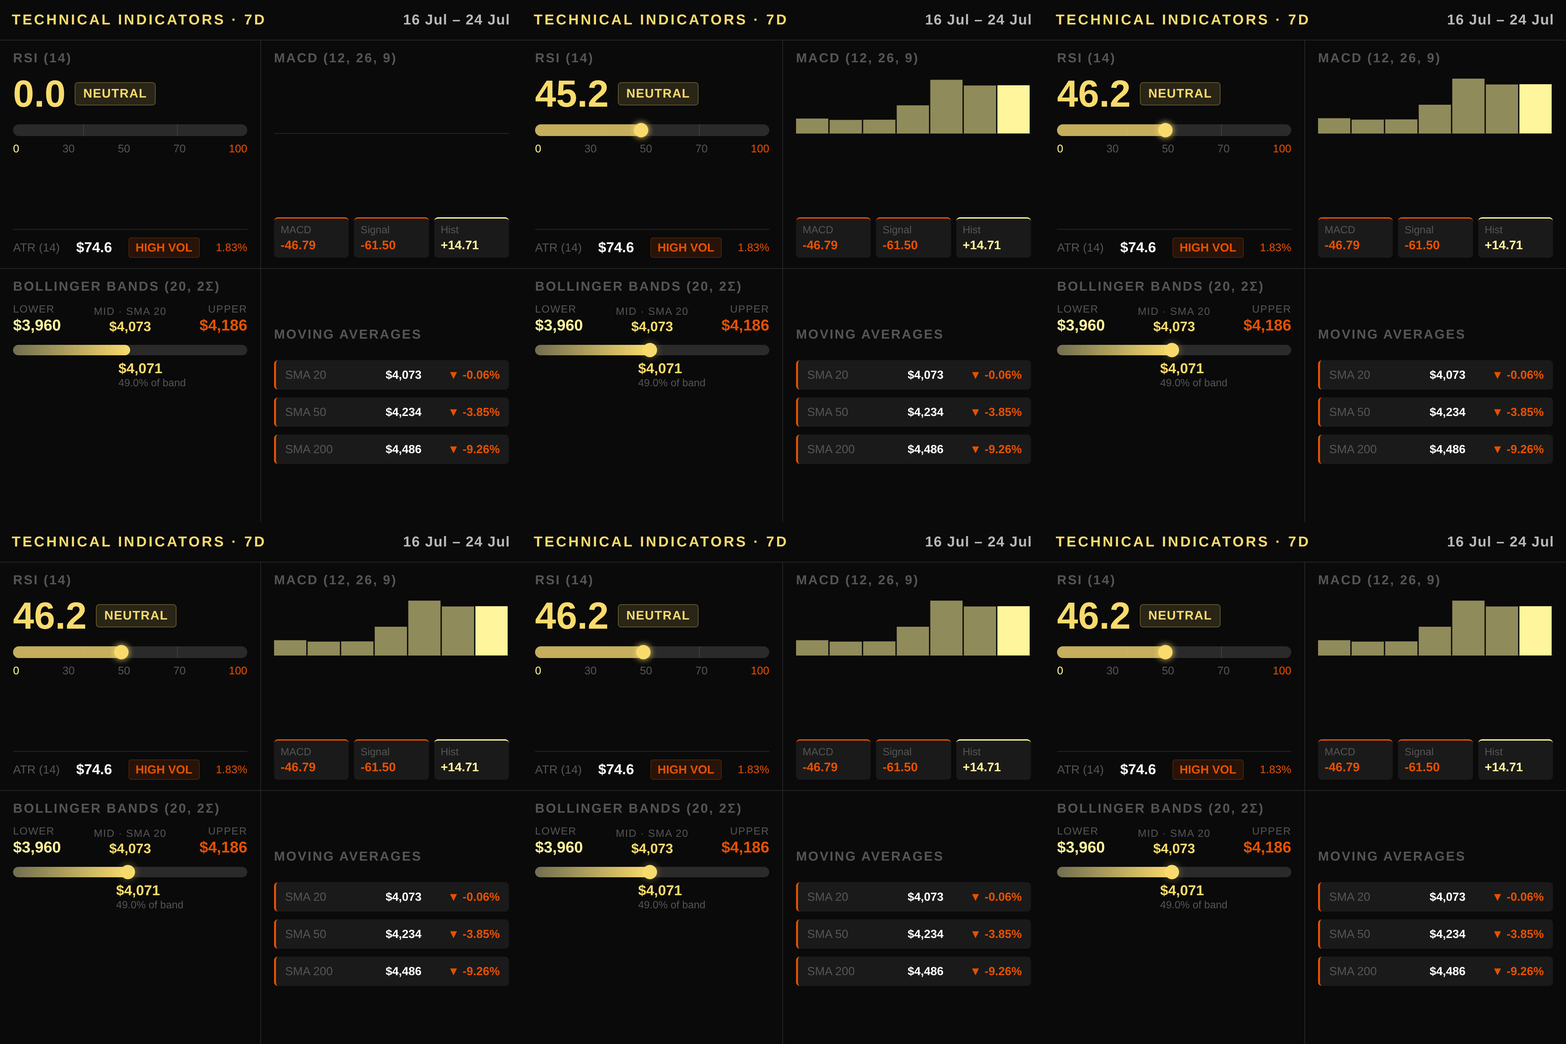
Gold is currently trading at USD 4067.6, which sits just below the SMA 20 at $4073.1 and well beneath the more significant resistance of the SMA 50 ($4233.9) and SMA 200 ($4486.4), confirming a strong downtrend structure in USD terms. The price action is testing critical support near the Bollinger Band lower band at USD 3959.8, with the next major floor identified at the 60-day low of approximately AUD 5,675 (equivalent to roughly USD 4120), though immediate technical focus remains on holding above USD 4050 to avoid a deeper correction toward the session lows near USD 3960. The relative strength index stands at RSI 46.2, indicating neutral-to-slightly-bearish momentum that has corrected from overbought levels but is not yet in deep oversold territory, suggesting limited immediate bounce potential until it clears the midline of neutrality.
The MACD line is positioned at -46.79 while hovering above the signal line of -61.5, generating a positive histogram value of 14.71. This divergence signals that downside momentum is easing despite the bearish trend, yet price has not confirmed a bullish crossover as long as it trades below both moving averages; traders should monitor for a sustained break back above the SMA 20 to validate any reversal signal before considering entries near current levels. Volatility measured by the Average True Range (ATR) at 74.6 suggests that intraday swings could easily exceed USD 50–100, making tight stops essential when trading this range-bound but directionally weak setup.
Key resistance sits firmly overhead with the SMA 20 acting as immediate friction near USD 4073, while stronger rejection zones exist at the SMA 50 ($4233.9) and the multi-month high of roughly AUD 6,810 (approximately USD 4765). Support is anchored beneath current pricing with the lower Bollinger Band offering a transient floor near USD 3960, backed by the recent session low around USD 3920. Australian investors watching these levels should note that any breach below USD 3960 would likely trigger stop-loss cascades and push prices toward psychological support at roughly AUD 5,710 (approx. USD 4330), while a reclaim of the SMA 20 could spark a short-covering rally back to test the SMA 50 resistance zone again in coming sessions.
Macroeconomic Factors
The US Federal Reserve maintains a funds rate of 3.63%, while real borrowing costs as measured by the 10Y Real Rate (TIPS) have climbed to 2.43%. This rise in real rates increases the opportunity cost for holding gold, a non-yielding asset, exerting downward pressure on prices despite recent volatility. The US Dollar Index (DXY) has edged higher over the month at 101.43, reinforcing headwinds as a stronger dollar makes global bullion more expensive and dampens demand from international buyers. Geopolitical tensions in the Middle East continue to inject risk premiums into safe-haven flows, partially offsetting macroeconomic drags on gold’s trajectory. The yield curve remains upward-sloping with a 10Y-2Y spread of 0.36%, indicating no signs of an inverted cycle that would typically precede recessions or sharp policy pivots. US CPI inflation stands at 3.73% year-over-year, keeping real rates elevated and limiting room for aggressive rate cuts in the near term.
Positioning and Market Flows
COT data indicates a net non-commercial long position of 183,910 contracts in XAU futures, reflecting bullish sentiment among large institutional speculators as they accumulate positions ahead of potential policy shifts. This speculative buildup contrasts with the commercial sector’s deep short hedge at -213,199 contracts, which represents standard production hedging rather than a bearish signal for price direction.
Meanwhile, ETF flows have turned decisively negative over the past month, with holdings dropping by 76.5 tonnes and net outflows totaling approximately $9.19 billion in June alone. These significant withdrawals suggest that institutional investors are reducing exposure to gold equities despite underlying market strength, creating a tension between futures positioning and equity fund behavior.
Central bank demand continues to provide structural support for the precious metal as global central banks diversify reserves away from traditional fiat currencies. This multi-year trend of official sector buying acts as a floor beneath spot prices even when private-sector ETF investors reduce their allocations during periods of dollar strength or rising yields.
Correlated Assets
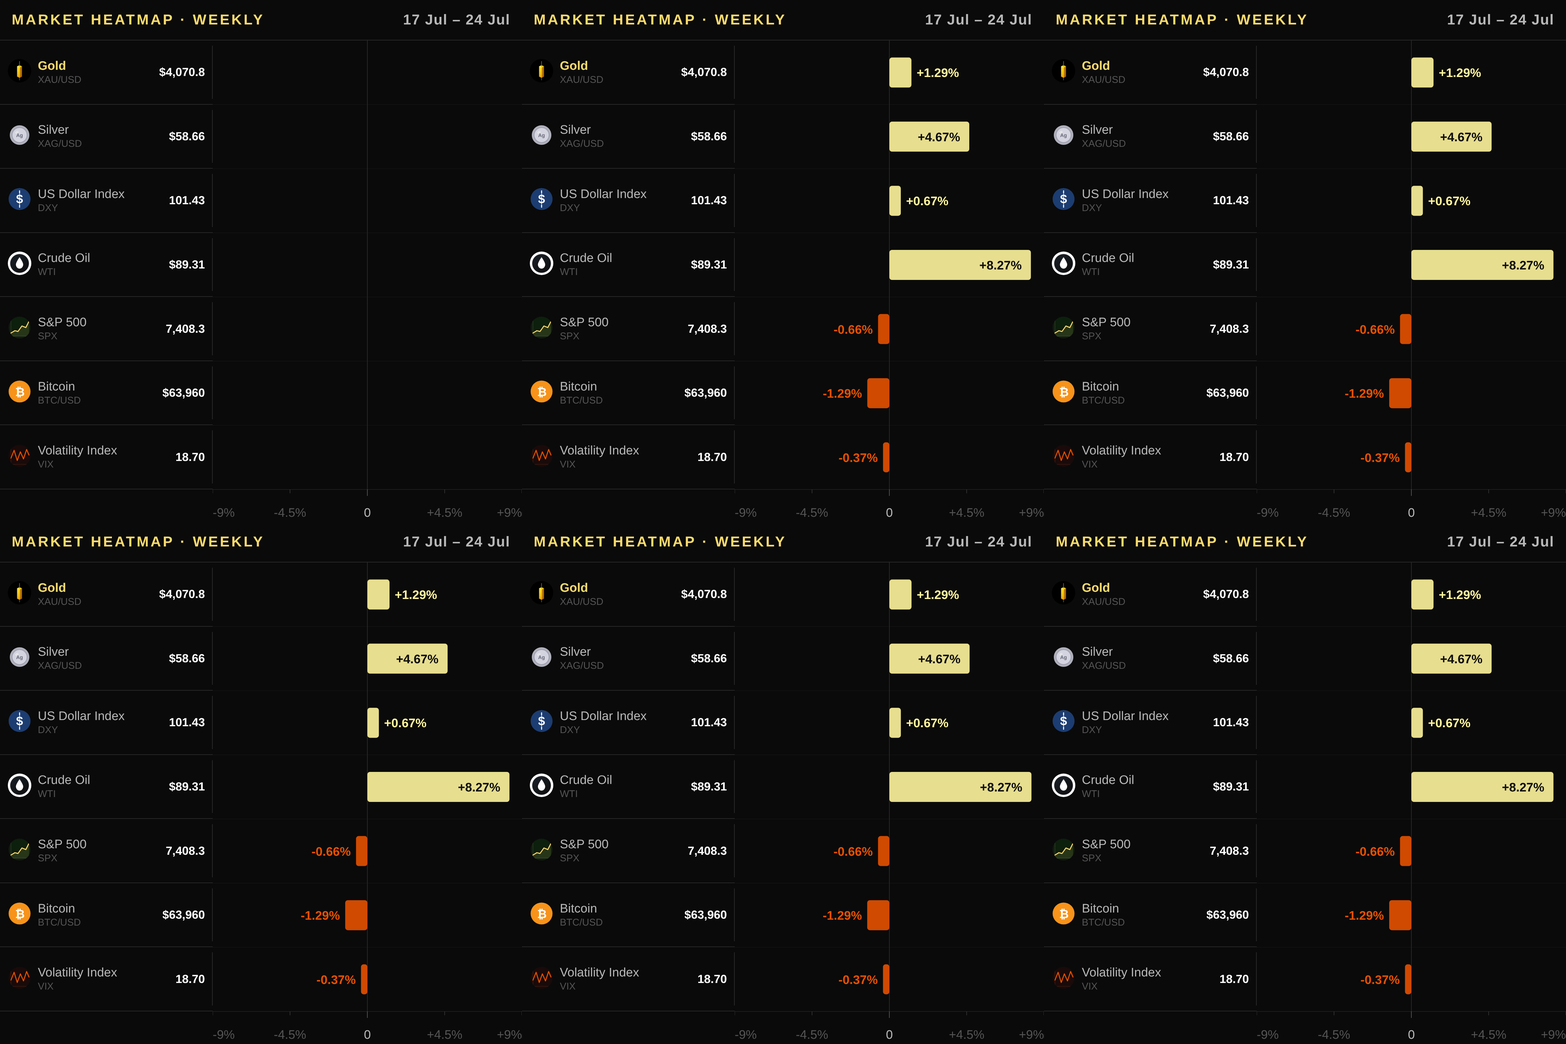
Gold's price action in XAU/USD is deeply intertwined with a basket of correlated assets that confirm its safe-haven status against US macroeconomic trends and global risk sentiment. The strengthening trend seen this week for copper, which rose 1.61% weekly after gaining 4.11% over the month, provides a fundamental bullish underpinning as industrial demand signals economic resilience alongside precious metal investment flows. Simultaneously, WTI oil prices surged an impressive 8.27% last week following a monthly gain of 24.18%, reinforcing the commodity currency thesis by lifting the value of risk-sensitive assets like the Australian dollar while supporting gold's appeal against US inflationary pressures. Conversely, silver posted its own strong rally with weekly gains of 4.67% and monthly returns of 0.53%, indicating broad-based demand across all precious metals despite broader equity weakness where the S&P 500 declined by 1.67% this week. The United States Dollar Index (DXY) remains relatively stable, having gained just 0.69% weekly after a flat monthly performance of 0.02%, which keeps foreign demand for gold steady as it avoids being made artificially expensive for global buyers. Bond yields are also rising with the US10Y climbing 4.3% over the month to levels that pressure non-yielding assets, yet real rates remain contained enough to limit severe headwinds compared to previous cycles where inflation was running hotter than current figures suggest. Finally, market volatility is moderating as the VIX index retreated by 4.05% monthly despite a weekly spike of 11.78%, suggesting that while uncertainty persists around geopolitical flashpoints like the Middle East conflict mentioned in recent headlines, investors are beginning to price in a stabilization phase rather than continuous crisis mode for precious metals portfolios.
Upcoming Catalysts
- US Gross Domestic Product — 2026-07-30: A major gauge of economic health that influences Fed policy and real rates, both critical for gold’s opportunity cost dynamics.
- US Non-Farm Payrolls — 2026-08-07: Labor market data often dictates expectations for rate cuts or hikes, directly impacting the dollar and bond yields relevant to XAU/USD pricing.
- US Consumer Price Index — 2026-08-12: This release determines inflation trajectory; rising CPI could support higher real TIPS rates if Fed funds stay firm, pressuring gold lower in AUD terms via a stronger USD.
- US Producer Price Index — 2026-08-13: Wholesale price pressures offer early signals for core inflation trends ahead of the PCE print and Fed pivot decisions that move global safe-haven flows.
Trading Idea
Given the strong downtrend and bearish bias, traders should consider a short position on XAU/USD with an entry zone between USD 4,035–4,100 (AUD 5,782–5,869). Place stop losses above USD 4,186.4 / AUD 5,991 to protect against a breakout through the upper Bollinger Band and immediate resistance. Target USD 3,960 / AUD 5,674 as downside is likely given price action near support levels and elevated real rates increasing opportunity costs for holding gold. Australian investors can replicate this short exposure by using inverse leverage products or waiting to buy physical Perth Mint bars and Kangaroo coins if they anticipate a further pullback before accumulation.
Price Outlook and FAQ
The expected price range for tomorrow is $3960–$4175 in USD (AUD 5,682 – AUD 5,980), bracketing today's spot level with the current figure sitting comfortably between these bounds. The one-week directional bias remains bearish as gold continues to trade under pressure from higher real yields and a strengthening US Dollar Index, though volatility is elevated given recent geopolitical tensions.
Is gold still an effective inflation hedge for Australian investors amidst rising CPI? With the 10-Year Real Rate (TIPS) at 2.43%, holding non-yielding assets like gold becomes increasingly costly as opportunity costs rise when US Treasury yields climb above domestic real rates. While Australia's annual CPI sits at a manageable 2.9%, global inflation expectations tied to higher TIPS yields can still weigh on the AUD price of bullion if investors rotate into bonds for better returns.
How do Reserve Bank and Fed rate decisions impact gold prices in Australian dollars? The RBA policy rate stands at 4.35%, while the US Fed Funds Rate is 3.63%, creating a narrowing differential that supports the Aussie Dollar when expectations align with lower US rates. A stronger AUD relative to USD pushes the local price of gold higher, whereas tighter global liquidity or rising TIPS yields can suppress demand for this non-income-generating asset regardless of domestic inflation data.
What are the best ways for Australian investors to gain exposure to physical and ETF-backed gold? Australian participants can access liquid markets via the Global X Physical Gold ETF (GOLD.AX) or Perth Mint Gold ETF (PMGOLD.AX), both listed on the ASX with low tracking error against spot metal. For direct ownership, investors may purchase certified Perth Mint bars or Australian Kangaroo coins from reputable local bullion dealers to store value outside of bank liabilities.
This article is for informational purposes only and does not constitute investment advice or a financial recommendation. Investing in financial assets involves risk.
Key Takeaways for Traders
- Market Stance: The market remains bearish as price holds below all major moving averages despite a positive histogram easing downside momentum; traders should wait for confirmation above the SMA 50 before adding to long positions.
- Technical Level: Focus on the $4,073 (AUD 5,819) Bollinger Band middle line and the nearby resistance at the 60-day high of $4,765; a decisive break above these levels would invalidate the current downtrend structure.
- Macro Driver: Monitor the rising US Real Rate trend driven by TIPS yields near 2.43%, which increases opportunity costs for non-yielding gold and acts as persistent headwinds against higher prices.
- Flow Signal: Be cautious of continued ETF outflows totaling nearly $9.19 billion monthly, indicating institutional investors are actively selling shares despite bullish speculative positioning in futures markets.
- Risk Consideration: Geopolitical volatility continues to provide a safe-haven buffer, but traders must hedge against the risk that rising real rates could override this premium and accelerate declines toward lower support zones.
