Market Bias
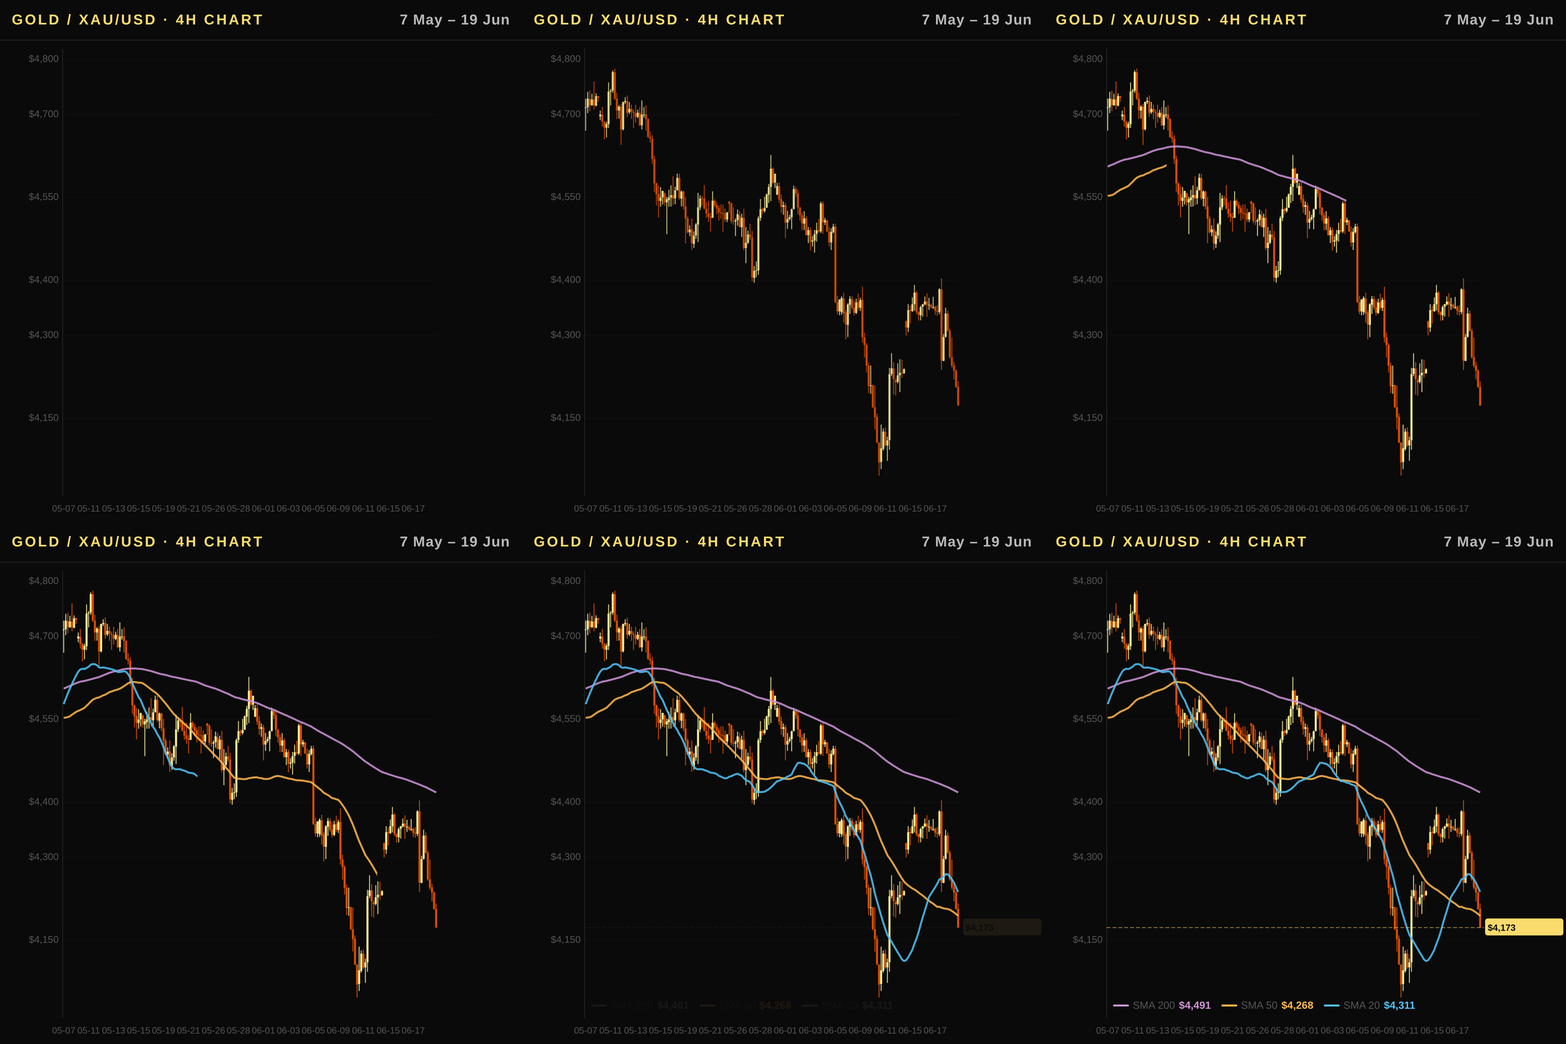
Bearish. Gold price today (US) is trading below all major moving averages with a RSI of 36.5, confirming a strong downtrend driven by rising real rates and persistent ETF outflows. The current macro environment favors the dollar and higher yields over non-yielding bullion until Fed policy pivots decisively toward cuts or inflation recedes further.
Executive Summary
Gold Price Today (XAU/USD) is currently trading at USD 4,172.9 within a strong downtrend characterized by persistent selling pressure across global markets. The primary driver for gold analysis remains elevated real yields and capital outflows from exchange-traded funds, with monthly holdings dropping significantly amid rising TIPS rates that increase the opportunity cost of holding this non-yielding asset. While geopolitical tensions continue to provide some safe-haven support, technical indicators confirm a bearish bias as price action struggles below key moving averages.
US Outlook: Fed Policy, Real Rates, and Gold's Safe-Haven Premium
- Fed policy trajectory: The Federal Reserve Funds Rate stands at 3.64%, having eased slightly from a year ago to 4.33%. While markets anticipate potential cuts later in the cycle, current hawkish rhetoric suggests rates may remain elevated longer than gold bulls prefer.
- Real rates and gold dynamics: Crucially for XAU/USD analysis, the TIPS yield indicates real interest rates are rising at 2.23% year-over-year. This upward drift increases the opportunity cost of holding non-yielding gold, acting as a significant bearish headwind on the current price structure which has already fallen roughly 10%.
- Dollar impact: The US Dollar Index (DXY) strengthens to 100.85 this week with a positive monthly trend at 1.76%, raising the effective cost for foreign buyers and suppressing global demand for USD-denominated bullion. A stronger currency directly contradicts gold's safe-haven thesis in non-US markets.
- Federal Reserve forward guidance: Recent FOMC statements emphasize data-dependence, implying that inflation persistence could delay rate cuts further than modeled by the futures market. This uncertainty creates volatility but generally favors a cautious stance for long positions until real rates stabilize lower.
Technical Analysis
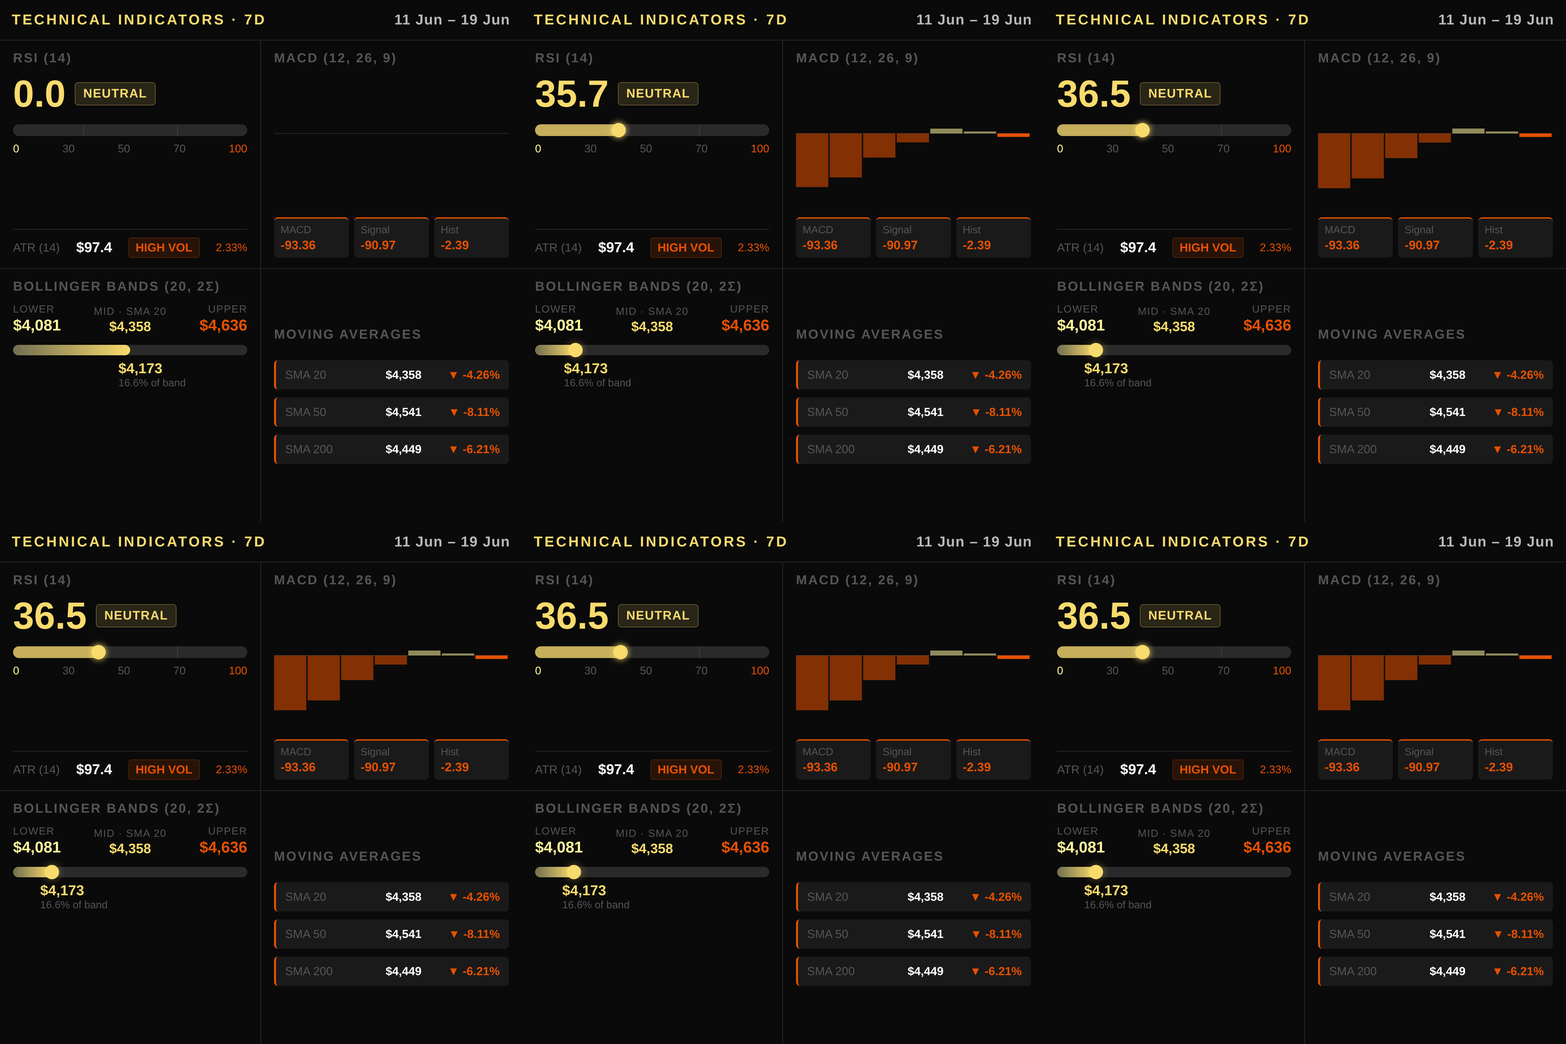
XAU/USD is in a confirmed strong downtrend, currently trading at $4172.9 well below its primary moving averages. Price has broken decisively through the SMA 50 at $4541.1 and failed to reclaim support near the lower Bollinger Band of $4080.5. The immediate trend is bearish, with each lower low reinforcing downward momentum against a backdrop of elevated volatility measured by an ATR of $97.4.
Moving average alignment reinforces this negative bias; price sits beneath all three key averages: the SMA 20 at $4358.4 and the SMA 200 at $4449.4, which act as dynamic resistance ceilings preventing any sustained recovery attempts. The M1 indicator supports a bearish narrative with an RSI of 36.5, indicating price is in oversold territory yet still unable to flip bullish momentum despite being below the neutral level of 50.
Momentum divergences remain absent; the MACD histogram sits at -2.39 while both the signal and actual lines hover near negative values around -$91, confirming that downward pressure persists without immediate signs of an exhaustion bottom. Bollinger Bands are contracting slightly after a sharp expansion during earlier declines, suggesting potential for continued mean reversion toward the middle band if volatility stabilizes.
Key technical levels to watch include resistance at $4358.4 (the SMA 20) and overhead pressure from the monthly average near $4541. Below current price, support exists around the lower Bollinger Band at $4080.5 and historically significant demand zones beneath that level if bears lose control of selling order flow in coming sessions.
Macroeconomic Factors
The Federal Reserve maintains a funds rate of 3.64%, yet market focus remains fixed on real rates as measured by the 10Y Real Rate (TIPS) at 2.23%. A rise in this metric to current levels increases the opportunity cost for holding non-yielding gold, creating a persistent headwind that outweighs safe-haven demand in the near term. While nominal yields have drifted higher alongside inflation data showing CPI YoY at 4.27%, it is these real returns that dictate asset allocation shifts away from precious metals. The current yield curve environment features a narrowing spread of only 0.27% between the 10-year and 2-year Treasury, signaling potential turbulence as investors weigh rate stability against inflation persistence.
Global demand for gold faces structural pressure from a strengthening US Dollar Index (DXY), which has climbed to 100.85 this week on a monthly basis of +1.76%. A stronger DXY makes the USD-denominated bullion more expensive for foreign buyers outside North America, effectively dampening global purchasing power and suppressing price appreciation despite geopolitical volatility elsewhere. This inverse relationship creates friction as central banks seek to diversify reserves into hard assets while their local currencies remain vulnerable against a robust greenback. Consequently, gold struggles to find consistent support when the dollar index rallies, limiting upside potential until the DXY stabilizes or enters a sustained downtrend.
Geopolitical tensions continue to provide an intermittent tailwind for XAU/USD prices through risk-off flows, yet this premium is often insufficient to counteract macroeconomic drag from tight monetary policy. Unlike other assets that rally on uncertainty before correcting, gold frequently absorbs geopolitical shocks without the same magnitude of move seen in equities or energy markets during periods of high real rates. The combination of rising TIPS yields and a resilient dollar suggests that fundamental support for prices remains fragile until fiscal deficits narrow to reduce long-term borrowing pressure. Investors must monitor whether central bank buying can offset these headwinds sufficiently to drive the price above key moving averages in coming weeks.
Positioning and Market Flows
The CFTC report dated June 9 shows non-commercial traders holding a net long position of 173,837 contracts, indicating bullish speculative sentiment among hedge funds and managed money over the past five weeks with an additional increase of 2,215 contracts. This positioning aligns with gold's status as a strategic reserve asset despite short-term price corrections.
In contrast to futures activity, ETF holdings have weakened significantly this month with outflows totaling approximately $-1.97 billion and a decline in physical equivalent reserves by 16 tonnes. These net outflows reflect institutional investors shifting capital away from exchange-traded gold vehicles toward other assets or cash equivalents during periods of dollar strength.
Central bank demand continues to provide structural support as global central banks accumulate gold for diversification purposes, though this multi-year trend operates independently of short-term retail flows and futures positioning metrics reported by the CFTC.
Correlated Assets
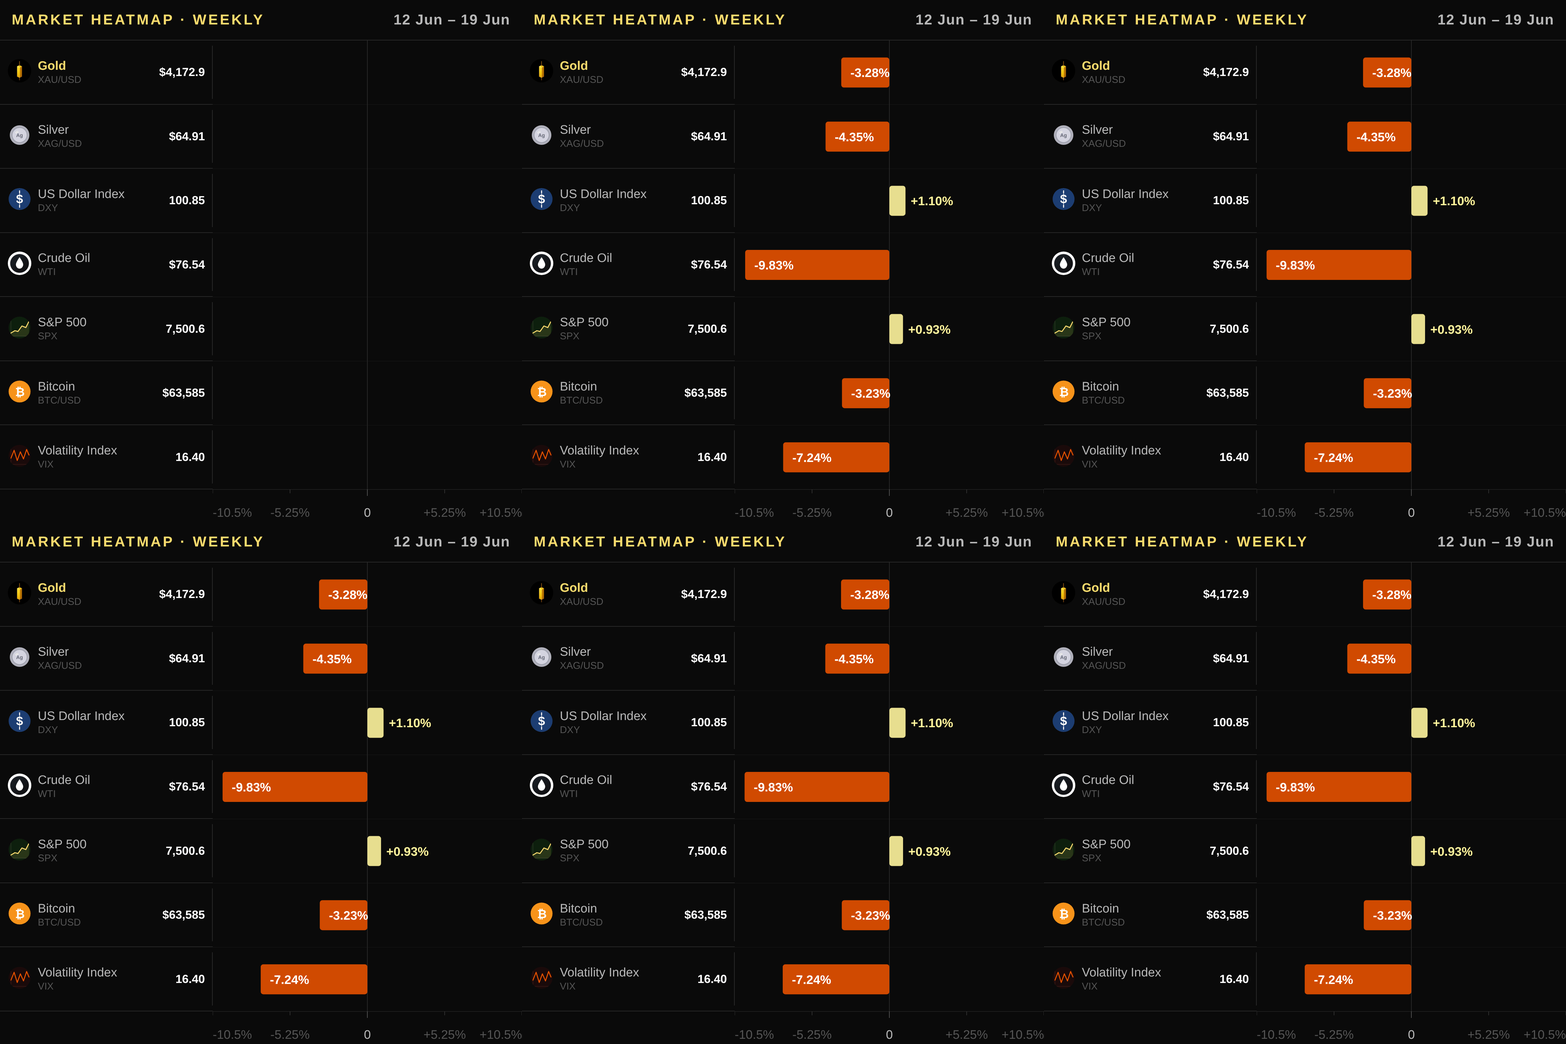
Gold's inverse correlation with US10Y at 4.45% remains intact, as rising real rates (TIPS yield of 2.23%) increase gold's opportunity cost for non-yielding investors. The US Dollar Index (DXY) sits at 100.85, showing weekly strength (+0.99%), which suppresses global demand by making bullion pricier in foreign currencies. Silver lags behind XAU/USD with a sharper decline (-4.35% weekly), reflecting its dual dependence on industrial copper and precious metals sentiment. Industrial metals like copper, trading at 6.337/lb, remain resilient despite oil volatility but show mixed momentum (weekly -1.45%, monthly +1.28%), limiting broad commodity-driven gold support. Energy weakness is pronounced with WTI falling -9.83% weekly, yet geopolitical tensions in the Middle East create an underlying risk premium that could reverse this trend quickly. Equities via SPX (7500.58) posted a modest +1.44% gain, contrasting gold's safe-haven role during uncertainty spikes tracked by the subdued VIX at 16.4. While BTC dropped -4.08% weekly to $63,584.72, reinforcing its current volatility rather than offering a stable refuge alternative for dollar-based portfolios.
Upcoming Catalysts
- GDP Release — 2026-06-25
- Non-Farm Payrolls (NFP) — 2026-07-02
- CPI Report — 2026-07-14
- PPI Data — 2026-07-15
Trading Idea
Given the strong downtrend and price trading below key moving averages, traders should consider a short position on XAU/USD with an entry zone between $4150 and $4200 USD. Place a stop loss above the SMA 20 at roughly $4360 to protect against potential mean reversion or a sudden dollar weakness that could spark a rally. The primary target is set near the recent support floor around $4030, where further downside momentum could accelerate if technical selling pressure persists. US investors can execute this strategy using SPDR Gold Shares (GLD) and iShares Gold Trust (IAU) on NYSE exchanges or by shorting COMEX gold futures through regulated brokers offering margin accounts for speculative trades.
Price Outlook and FAQ
Gold price today (US) is expected to trade within a range of $4031–$4286 tomorrow as volatility narrows following recent losses, with a bearish one-week directional bias targeting the 60-day low support near $4031 before potential resistance from the SMA50 at $4541.
Is gold currently an effective inflation hedge for US investors given persistent CPI readings? With annualized consumer prices expanding at 4.27%, gold faces a structural headwind as real interest rates rise; however, its non-yielding nature allows it to preserve purchasing power when nominal Treasury yields fail to fully offset high headline inflation or geopolitical risk premiums surge unexpectedly.
How do Federal Reserve rate decisions and the 10-year TIPS yield impact XAU/USD prices? The Fed funds rate sits at 3.64%, but gold is more sensitive to real rates, where the 10Y Real Rate (TIPS) has climbed to 2.23%; rising real yields increase the opportunity cost of holding this non-income-generating asset, creating bearish pressure on prices unless a sharp shift in inflation expectations or policy surprises occurs.
Where can US investors purchase gold for their portfolios today? Investors seeking exposure via equities should consider SPDR Gold Shares (GLD) and iShares Gold Trust (IAU), which trade on the NYSE, while those preferring physical metal can source coins and bars from reputable US dealers like APMEX, JM Bullion, or directly through the United States Mint.
This article is for informational purposes only and does not constitute investment advice or a financial recommendation. Investing in financial assets involves risk.
Key Takeaways for Traders
- Current Stance: The market is firmly bearish as price trades well below all major moving averages and RSI indicates oversold momentum; traders should look for short entries near current levels while waiting for a reclaim of resistance to attempt long positions.
- Key Technical Level: Watch the 60-day high at $4879.7 closely, as this overhead resistance acts as immediate pressure that must be breached before any sustainable bullish reversal can occur in XAU/USD analysis.
- Macro Driver: Monitor rising real yields driven by TIPS moving higher to 2.23%, which increases the opportunity cost of holding non-yielding gold and suppresses price gains despite weak dollar dynamics.
- Flow Signal: Be cautious as large ETF outflows totaling nearly $2 billion this month contradict speculative futures positioning, indicating institutional investors are reducing exposure even while COT data shows net long contracts among speculators.
- Risk Consideration: A sudden spike in the DXY or a hawkish FOMC pivot could accelerate downside toward the 60-day low support at $4031.0 before any potential rebound attempts materialize for gold price today traders to watch.

