Market Bias: Neutral-to-Bearish
Executive Summary Gold is currently trading at $4523.2, facing immediate pressure as it tests the critical SMA 20 at $4610.8, marking a divergence between the broader yearly uptrend and immediate technical weakness. While speculative positioning remains bullish with 159,833 non-commercial contracts and ETF flows show a robust $6.59 billion monthly inflow, the asset is struggling against a backdrop of rising real interest rates and a strengthening US Dollar. The recent one-month decline of -3.87% suggests that the market is absorbing profit-taking ahead of key macro data releases, with the 10Y Treasury yield climbing to 4.32%, which directly compresses gold's yield-bearing advantage.
Technical Analysis
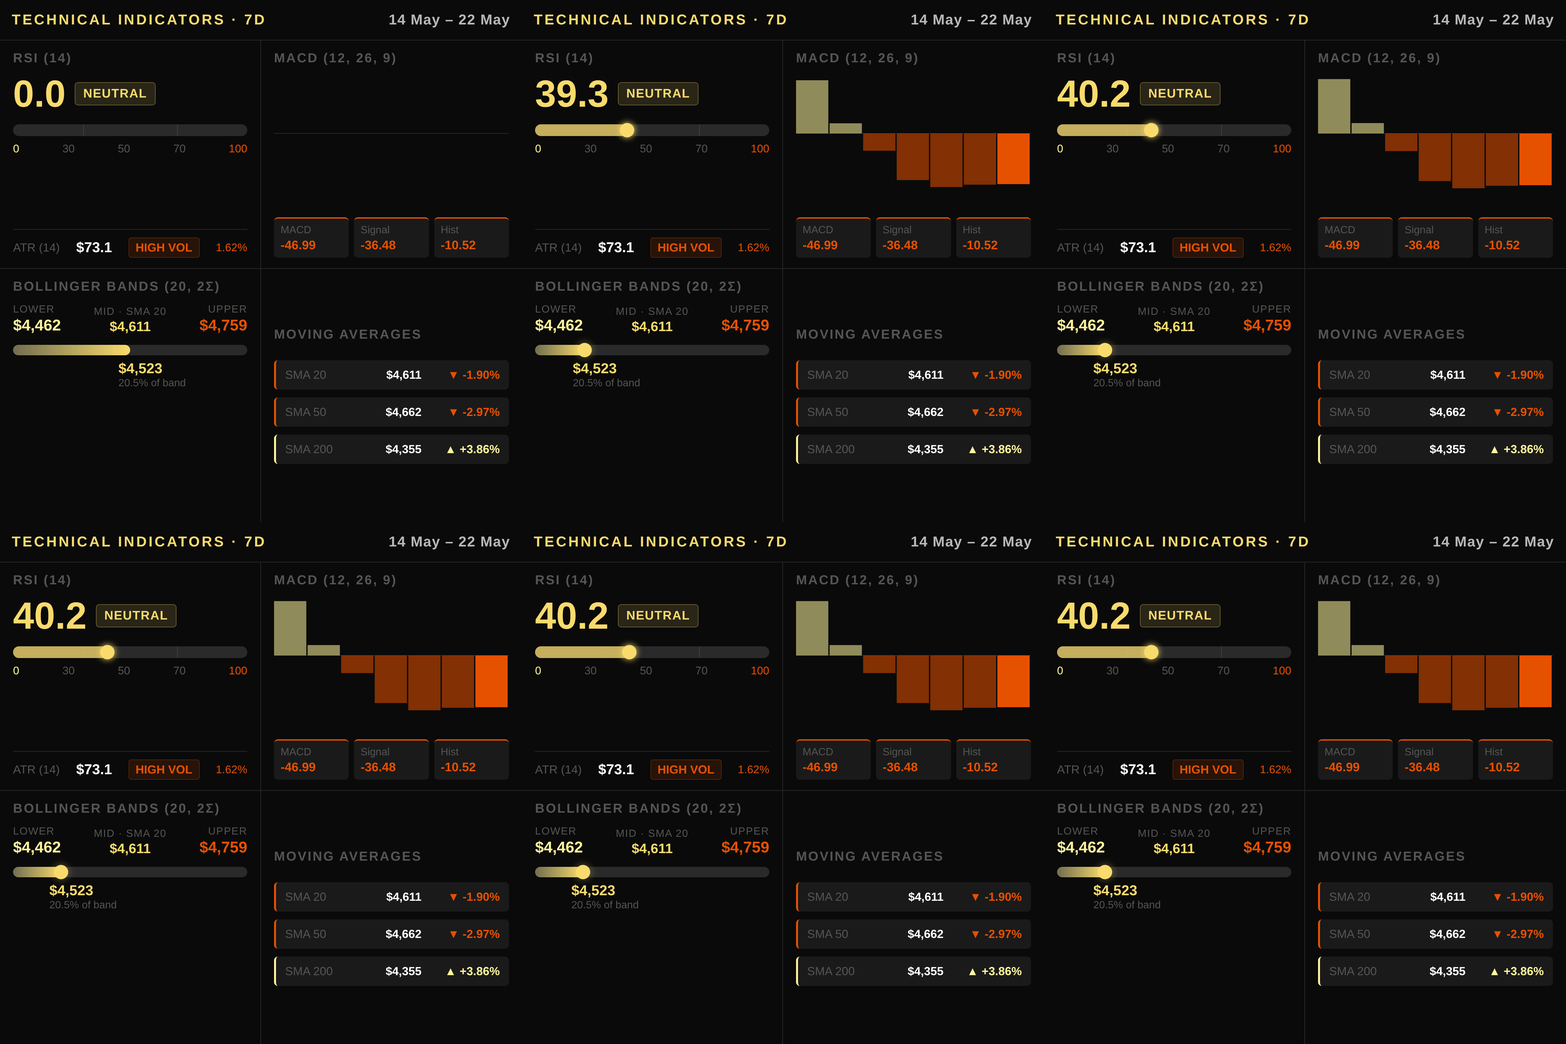
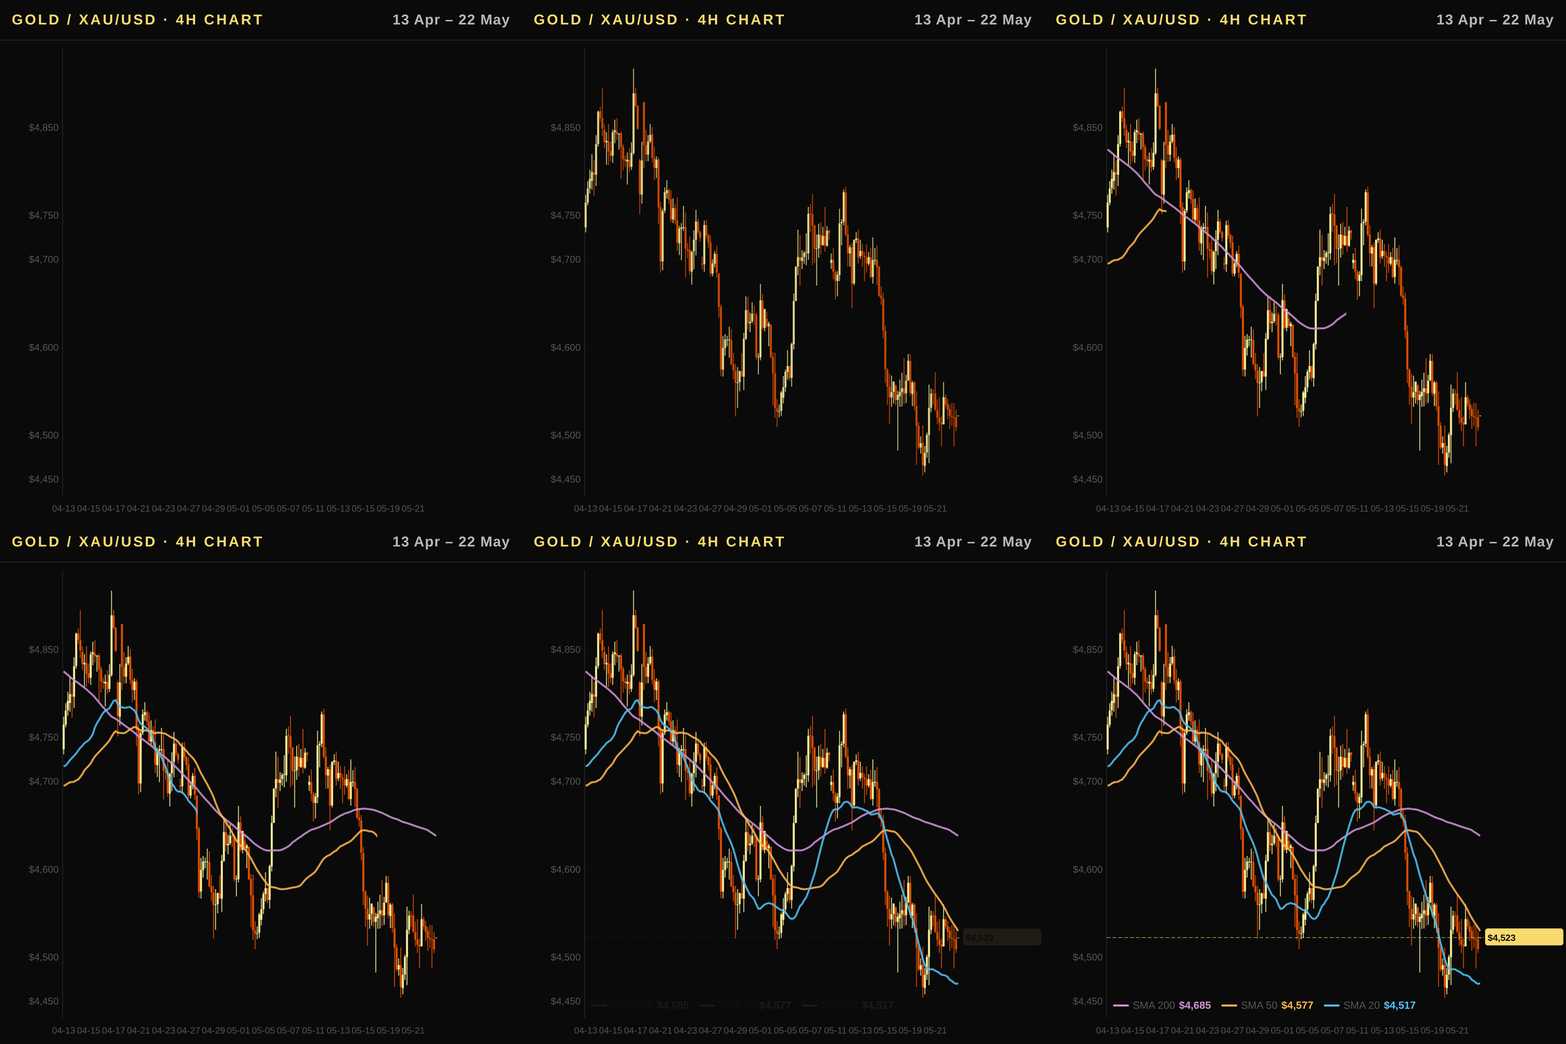
Gold is currently executing a corrective pullback within a larger uptrend, having fallen 0.72% over the last week. Price action has retreated from the 52-week high of $5586.2 and is now hovering just below the SMA 20 ($4610.8) and SMA 50 ($4661.5), indicating that momentum is fading as the asset tests the Bollinger Band middle line. The RSI (14) sits at 40.2, suggesting the asset is approaching oversold territory but lacks the momentum to reclaim the upper band of $4759.2 without a fundamental catalyst. The MACD is deeply negative at -46.99, with the histogram showing bearish divergence at -10.52, signaling that the short-term trend remains downward despite the long-term structural support found at the SMA 200 ($4354.9). Volatility, measured by an ATR of 73.1, is elevated, warning traders of potential wide swings near the support level of $4100.8 and the looming resistance at $5405.0.
Macro & Fundamental Drivers
The fundamental landscape presents a mixed bag for gold, with the Fed Funds Rate holding steady at 3.64% while inflation remains sticky at 3.95%. This environment has pushed the US 10Y Treasury Yield up to 4.32%, increasing the opportunity cost of holding non-yielding assets like gold. Real interest rates, currently at 2.18%, remain positive, which historically exerts a ceiling on gold prices. However, geopolitical tensions continue to provide a risk premium, as seen in recent headlines regarding the Middle East conflict, preventing a total capitulation despite the macro headwinds. The US Dollar Index (DXY) is trading near 99.32, having risen slightly this week, which typically correlates with lower gold prices but has recently shown a decoupling as investors seek safety.
Market Positioning & Flows
Despite the price weakness, market positioning suggests underlying institutional support. The latest CFTC report dated 2026-05-19 reveals a speculative bias that remains BULLISH, with non-commercial net long positions at 159,833 contracts. This bullish stance persists even after a reduction of 4,173 contracts over the past five weeks, indicating that smart money is still accumulating dips. Simultaneously, the ETF sector is driving demand, with total holdings rising to 4137.1 tonnes following a massive monthly inflow of $6.59 billion. This massive cash inflow contrasts with the recent price dip, suggesting that the $4523.2 level may be a buying opportunity for institutions rather than a peak.
Correlated Assets
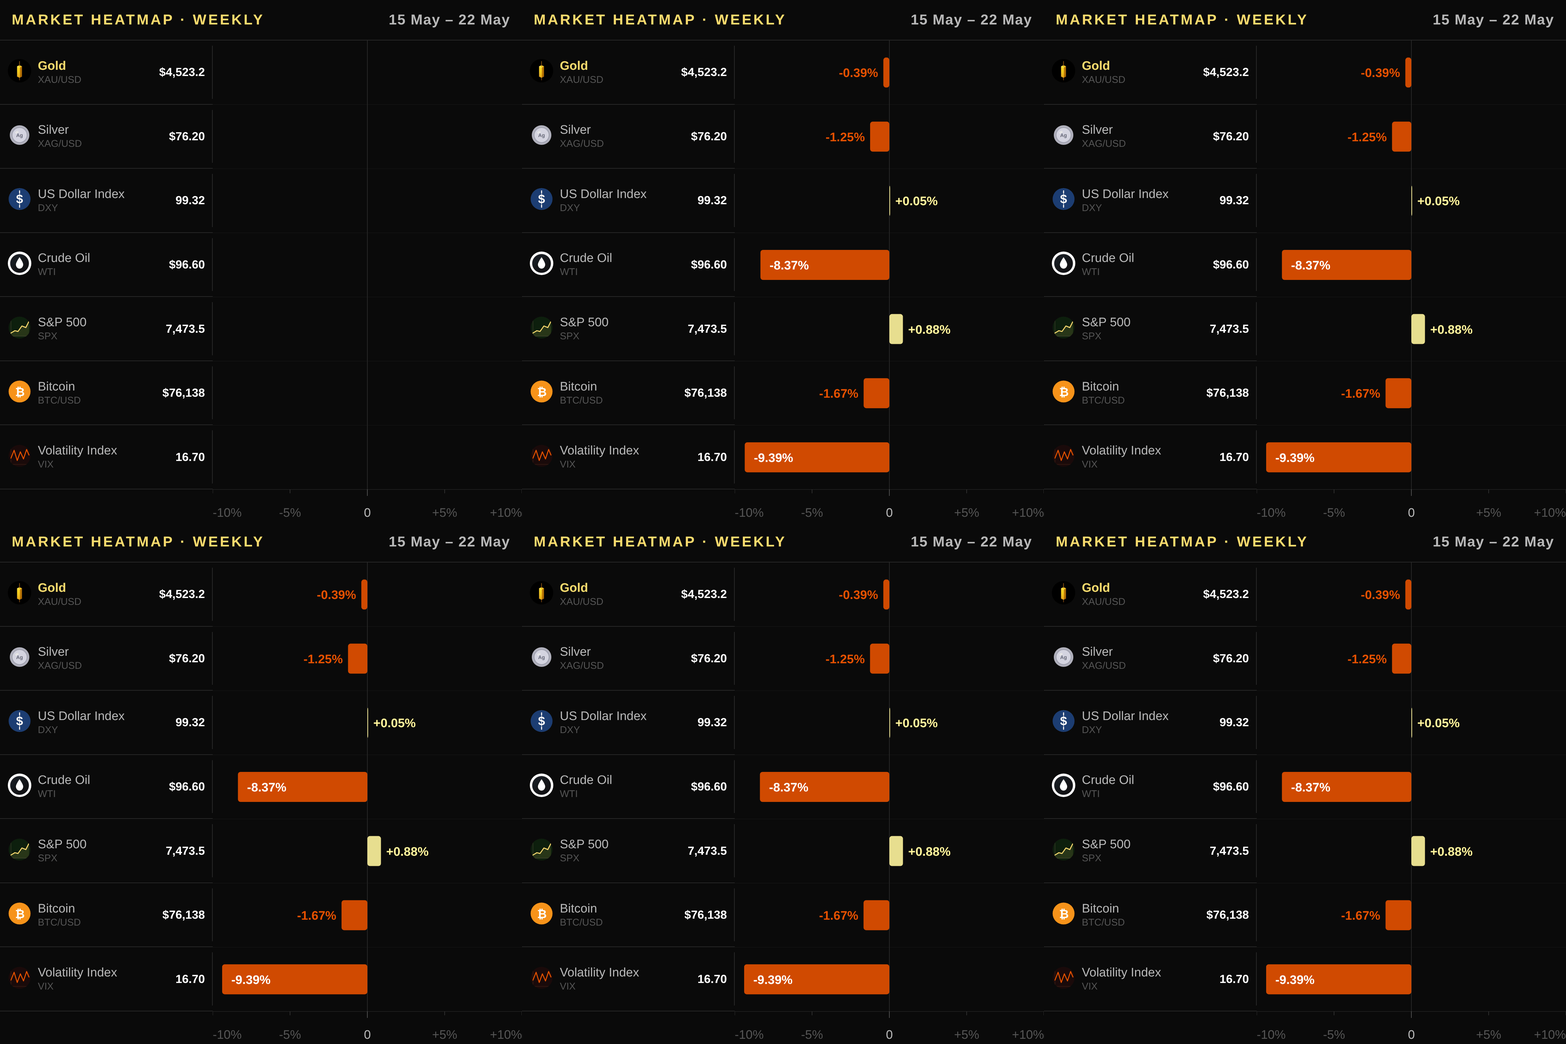
The broader market context supports a cautious outlook for gold. The US 10Y yield is up 5.44% this month, creating a direct negative correlation with gold prices. Conversely, the VIX has dropped significantly, down 9.39% this week, which often dampens gold's safe-haven appeal in the absence of acute crises. The SPX is up 5.14%, indicating risk-on sentiment that favors equities over precious metals. While Silver has declined -1.25%, mirroring gold's weakness, Copper remains relatively stable, suggesting industrial demand is not the primary driver of the current metal market. Bitcoin is also down -3.06% this month, reinforcing the risk-off rotation into traditional assets like gold, though gold's performance lags its crypto counterpart's resilience.
Upcoming Catalysts
The next 30 days are critical for determining gold's direction. The NFP report on 2026-06-05 will be pivotal for assessing labor market strength and subsequent Fed policy. More importantly, the CPI release on 2026-06-10 and PPI on 2026-06-11 will dictate whether inflation remains sticky enough to keep real rates high or if it cools sufficiently to allow for rate cuts. A surprise softness in these reports could trigger a rapid repricing of gold upwards. Additionally, the Fed Minutes on 2026-06-13 and the FOMC meeting on 2026-06-17 will offer clarity on the "higher for longer" narrative. Any hint of dovishness could see gold reclaim the $4610.8 SMA 20 level.
Risk Assessment
The primary risk to the bullish thesis is a strengthening US Dollar coupled with higher-than-expected inflation, which would lock in real rates at levels that are hostile to gold. If the US 10Y yield breaks above 4.50%, gold could face a deeper correction toward the $4354.9 SMA 200 support. A second major risk is a reversal in ETF flows, where the current $6.59 billion monthly inflow dries up, signaling a shift in investor sentiment. Conversely, a geopolitical escalation in the Middle East could provide a short-term spike, but sustained gains would require a fundamental change in the interest rate environment.
Strategic Recommendations
Given the technical breakdown below the SMA 20 and the macro headwinds, the strategic recommendation is to adopt a wait-and-see approach with a slight bias toward accumulation on dips. Traders should look for a reclaim of the $4610.8 SMA 20 as a confirmation of trend reversal. For long-term investors, the massive ETF inflows suggest that $4523.2 is a reasonable entry point, provided the NFP and CPI data do not shock the market in a negative direction. Hedging strategies involving Silver could be considered if gold fails to hold the $4400 psychological level.
Conclusion
Gold is at a inflection point, caught between strong long-term structural support and short-term technical and macro pressure. The asset has demonstrated resilience against rising yields and a stronger dollar, but the RSI and MACD indicate a need for a catalyst to reverse the downward momentum. With 159,833 speculative contracts backing a bullish view and $6.59 billion in ETF flows supporting demand, the fundamentals remain intact. However, until the US 10Y yield stabilizes and the Fed signals a clearer path to rate cuts, gold is likely to remain range-bound between $4354.9 and $4759.2. Investors should monitor the upcoming CPI and NFP data closely for any shifts in the narrative.
Disclaimer
This analysis is based on market data as of 2026-05-23. Precious metals markets are highly volatile and influenced by geopolitical events and macroeconomic data. This report is for informational purposes only and does not constitute financial advice. Investors should conduct their own due diligence and consult with a qualified financial advisor before making investment decisions.
Detailed Data Table: Key Technical Levels & Indicators
| Indicator | Value | Interpretation |
|---|---|---|
| Current Price | $4523.2 | Trading below SMA 20, indicating short-term weakness. |
| SMA 20 | $4610.8 | Immediate resistance; reclaim needed for bullish trend. |
| SMA 50 | $4661.5 | Mid-term trend resistance; significant if broken. |
| SMA 200 | $4354.9 | Major long-term support; critical floor for bulls. |
| 52-Week High | $5586.2 | Previous peak; difficult to reclaim without fundamental shift. |
| RSI (14) | 40.2 | Approaching oversold; potential for mean reversion. |
| MACD | -46.99 | Strong bearish signal; histogram at -10.52 confirms momentum. |
| Bollinger Band Mid | $4618.4 | Price is below the middle band, suggesting underperformance. |
| Volatility (ATR) | 73.1 | High volatility expected; wide stop-losses recommended. |
| ETF Holdings | 4137.1 tonnes | High institutional ownership; supports floor price. |
| Monthly Inflow | $6.59 billion | Massive demand despite price decline; bullish signal. |
| US 10Y Yield | 4.32% | High yield environment; negative correlation with gold. |
| Real Interest Rate | 2.18% | Positive real rates generally cap gold upside. |
| Speculative Bias | Bullish (159,833) | Non-commercials are net long; smart money accumulation. |
Key Takeaways for Traders
- Wait for Confirmation: Do not chase longs immediately; wait for a clean break above the SMA 20 ($4610.8) with volume.
- Watch the Yields: Any break in the US 10Y above 4.40% could trigger further selling pressure.
- Geopolitical Hedge: While macro is bearish, geopolitical instability (Middle East) acts as a floor, preventing a crash below $4354.9.
- ETF Flow Watch: Monitor daily ETF flows; a sudden drop in inflows could accelerate the decline toward the SMA 200.
- Silver Correlation: Silver is moving in tandem with gold; a breakout in silver could signal a broader precious metals rally.
