Market Bias
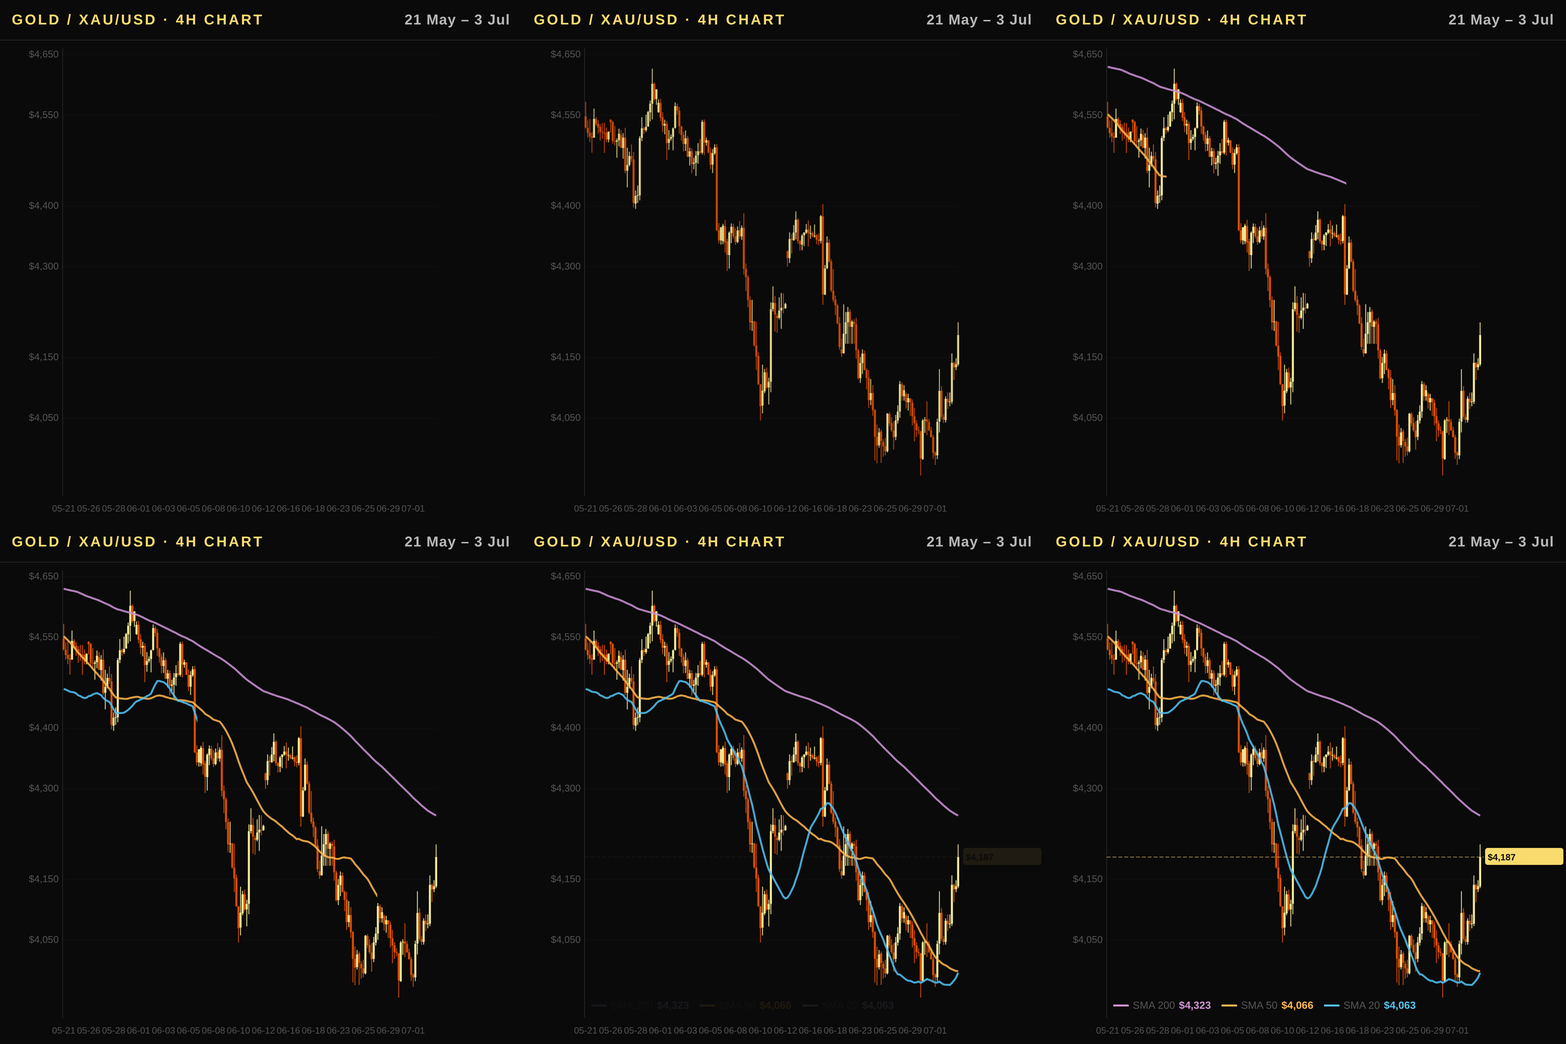
Bearish. Despite a strong weekly gain of 2.66%, the gold price today trades below its 50- and 200-day moving averages in a strong downtrend, with a neutral RSI (47.1) and a negative MACD line pointing to persistent downside pressure. Net speculative long positioning and safe-haven demand amid Middle East tensions offer a partial counterweight, and a weakening AUD lifts the local price to AUD 6,037, but ETF outflows and elevated real rates near the TIPS rate of 2.25% keep the near-term structure bearish.
Executive Summary
The gold price today in Australia stands at 6,037 AUD/oz, reflecting a strong weekly gain of 2.66% despite broader market headwinds and significant ETF outflows totaling $1.97 billion this month. In USD terms, the asset trades near $4,187, maintaining its status as a resilient non-yielding store of value while real interest rates climb to 2.25% on TIPS yields. This analysis underscores that gold remains attractive for Australian investors seeking portfolio diversification against inflation and currency volatility, even as institutional selling pressure weighs on the near-term technical structure.
Australia Outlook: RBA Policy, the Aussie Dollar, and Gold in AUD
- Gold Pricing Dynamics: Australian investors purchase gold priced locally; when the AUD weakens against the USD (currently at 1.4419), the local price rises to ~AUD 6,037 per ounce even if global prices stay flat, creating a bullish bias for domestic holders. Conversely, an appreciating Aussie dollar erodes returns by driving down the AUD-denominated gold price when converted from US benchmarks.
- Commodity Currency Context: The Australian dollar functions as a commodity currency highly correlated with WTI oil and metals demand; however, the current monthly decline in WTI prices (-26.07%) suggests reduced risk appetite which typically supports the USD but can create divergence if global growth fears intensify alongside energy market stress.
- RBA Policy Divergence: The Reserve Bank of Australia sets an independent policy rate of 4.35%, maintaining a narrowing differential against the Fed Funds Rate (which stands at 3.63%). A tighter RBA stance relative to US rates tends to strengthen the AUD, exerting downward pressure on domestic gold prices by increasing local purchasing power for non-yielding assets.
- Inflation and Growth Fundamentals: Domestic macroeconomic stability is anchored by an annual CPI of 2.9%, which remains within acceptable bounds but constrains aggressive rate cuts that might otherwise weaken the currency to support bullion demand, while GDP growth of 1.4% indicates a resilient economy balancing against external headwinds from weaker commodity prices.
Technical Analysis
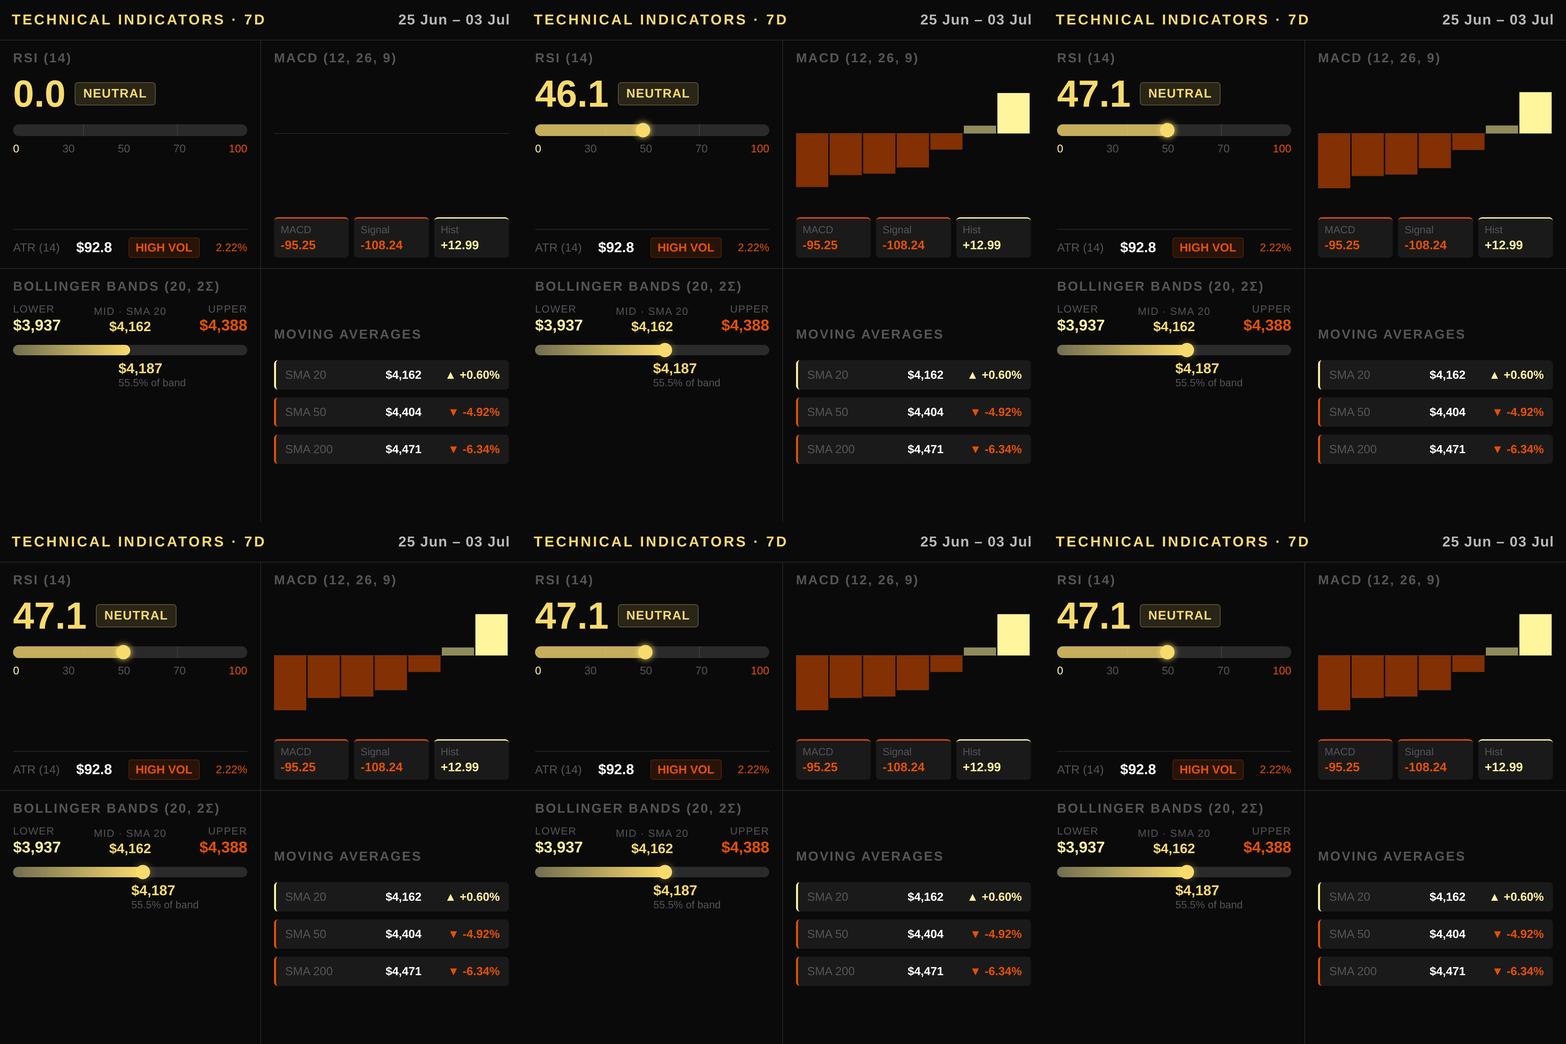
The gold price today confirms a strong downtrend in USD, with gold trading at $4187.3, just above the SMA 20 of $4162.4 but significantly below both the SMA 50 ($4404.1) and SMA 200 ($4470.7), indicating persistent bearish momentum against key moving averages. The RSI sits at 47.1, remaining near neutral territory rather than in oversold conditions, suggesting room for further downside before a potential bounce forms. MACD remains negative with the histogram showing slight bullish divergence as it turns positive (+12.99), hinting that selling pressure may be easing slightly even though trend direction is still down. Bollinger Bands show price hovering near the middle band at $4162.4, while volatility measured by ATR stands at 92.8. Key resistance sits clearly above current levels, anchored first by the 50-day average and then the stronger psychological barrier of $4470 to $4480; support is found below price around $3962, which acts as immediate order flow accumulation in case of deeper corrections.
Macroeconomic Factors
The Federal Reserve maintains its funds rate at 3.63%, with the broader policy stance anchored by a 10-year Treasury yield of 4.47% and real rates—measured directly via TIPS—at 2.25%. These elevated real yields increase the opportunity cost for holding non-yielding gold, exerting persistent downward pressure on prices despite safe-haven demand from geopolitical instability. The US Dollar Index (DXY) sits at 100.86, having weakened slightly over the past week but rising 1.65% monthly; a stronger dollar typically makes XAU/USD more expensive for foreign buyers, dampening global demand and reinforcing bearish momentum in gold analysis today. Geopolitical tensions continue to provide an intermittent risk premium that partially offsets headwinds from tighter liquidity conditions. The yield curve remains normally shaped with a 10Y–2Y spread of 0.35%, reflecting orderly monetary tightening rather than recessionary expectations, which limits speculative upside for gold in the near term.
Positioning and Market Flows
The CFTC Commitment of Traders (COT) report for June 2026 reveals a net speculative long position of 181,339 contracts in XAU/USD futures, reflecting bullish sentiment from large institutional investors. This accumulation coincides with rising geopolitical tensions that drive safe-haven demand into the spot market despite elevated real yields.
In contrast to the optimism seen in futures markets, physical ETF holdings have contracted by approximately 16 tonnes this month, representing a net outflow of roughly $2 billion USD. These significant reductions indicate institutional investors are selling gold shares and reallocating capital toward other assets, which creates downward pressure on prices that contradicts the bullish COT positioning.
Central bank demand remains a critical structural support for XAU/USD over the longer term. While commercial traders maintain net short positions to hedge production risks, sovereign purchases continue to provide a floor beneath the asset class during periods of currency devaluation or economic uncertainty worldwide.
Correlated Assets
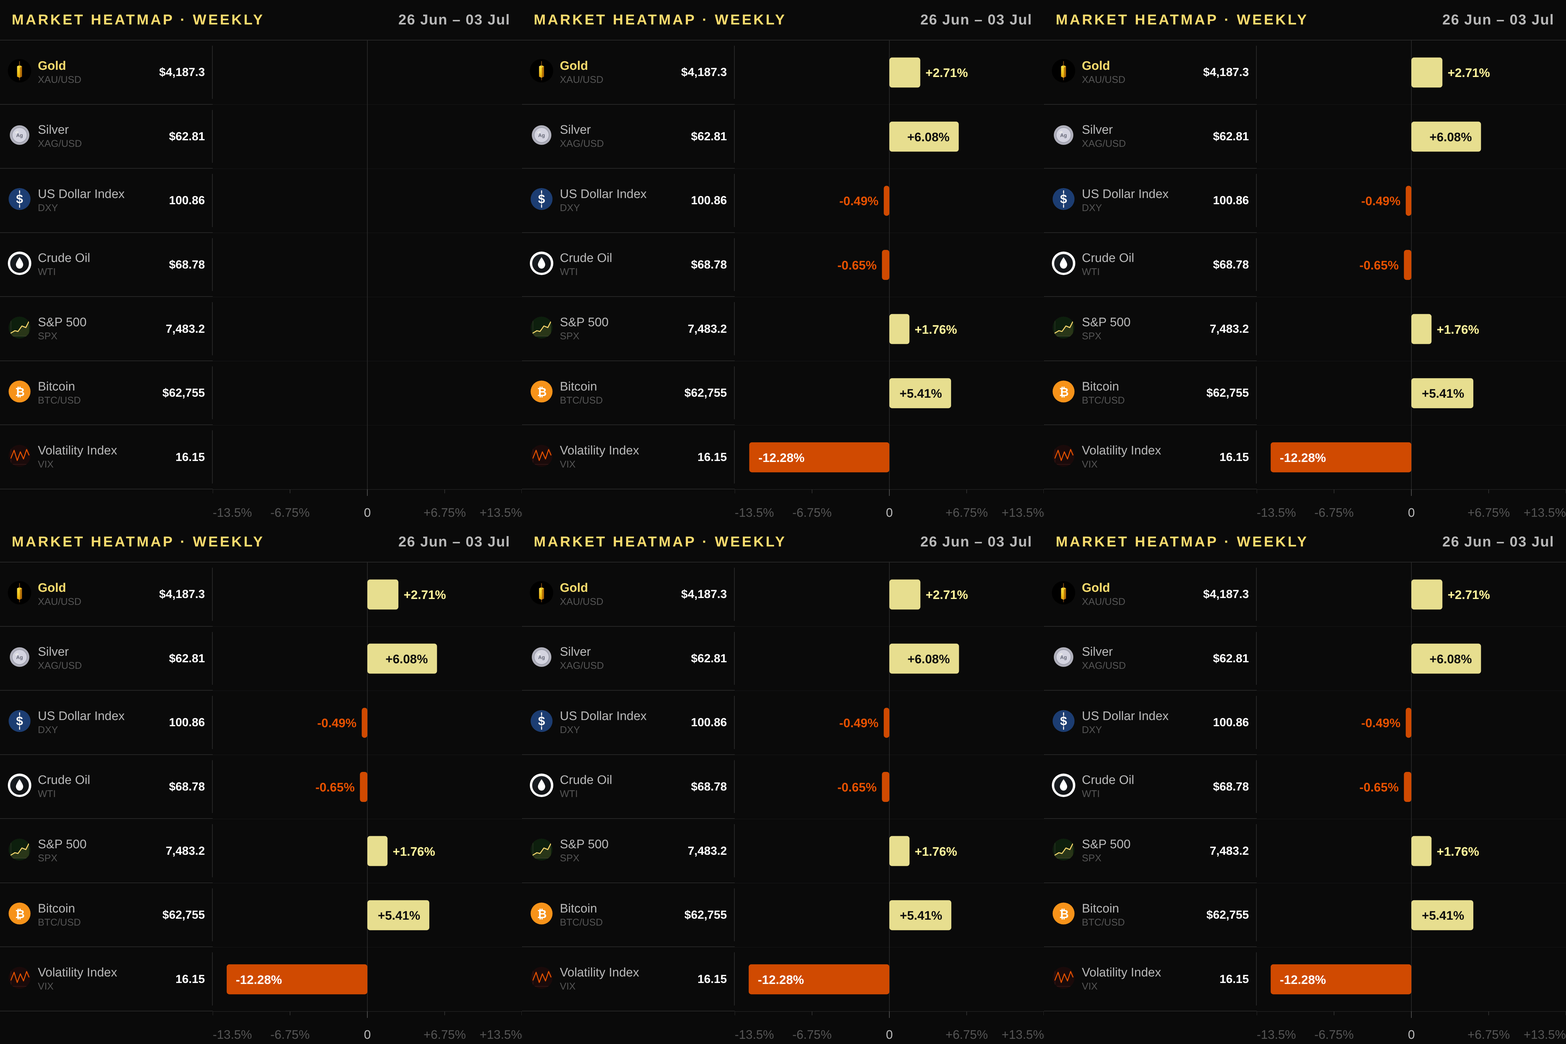
The performance of gold is closely tied to its correlated assets, where divergences in direction provide critical context for the XAU/USD thesis. The US Dollar Index (DXY) currently sits at 100.86 with a weekly decline of -0.56%, while monthly momentum shows a gain of 1.65%; this mixed trend supports gold as the dollar's inverse relationship creates intermittent buying opportunities despite recent strengthening pressure. Real yields, represented by the US 10Y Treasury yield at 4.47% and rising real rates via TIPS at 2.25%, increase the opportunity cost for holding non-yielding assets like bullion, acting as a persistent headwind against prices near current levels of USD 4187.3. Copper futures trade at USD 6.224/lb with weekly gains but monthly losses reflecting broader industrial demand concerns that often correlate negatively with precious metals during downturns in the global risk cycle. Silver shows contrasting volatility, rising sharply on a weekly basis to reach USD 62.815 before suffering significant monthly declines of -14.86%, highlighting its higher sensitivity to both gold trends and industrial usage patterns within manufacturing sectors. The S&P 500 index remains at 7483.24 with mixed momentum, suggesting that equity market resilience does not always translate directly into safe-haven flows for XAU/USD during periods of geopolitical uncertainty in the Middle East. WTI crude oil prices have dropped significantly over the month to USD 68.78 amid regional conflicts and supply disruptions, a development that typically weakens commodity currencies like the AUD but fails to immediately depress gold due to its safe-haven premium against global instability fears. The VIX fear gauge has declined substantially this week at -14.51%, yet monthly readings remain elevated enough to suggest underlying anxiety could support further gains if geopolitical tensions escalate again. This reinforces gold’s role as a diversifier during stress events, when other assets can falter under sudden volatility.
Upcoming Catalysts
- CPI Release — 2026-07-14
- PPI Release — 2026-07-15
- GDP Release — 2026-07-30
Trading Idea
Given the strong downtrend and bearish bias, investors should consider a short position entering between $4150–4200 USD (AUD 5,984–6,056) near current levels. Place a stop loss above $4270 USD (AUD 6,157) to protect against potential risk-off spikes or technical rebounds off the SMA 20 support zone. The initial target is set at $4050 USD (AUD 5,840), targeting a move toward the mid-Bollinger Band and recent consolidation lows where selling pressure may intensify. Australian investors can gain exposure to this view by shorting via CFDs or utilizing inverse products, while hedging long positions through physical allocations like Perth Mint bars or Kangaroo coins if holding bullion directly.
Price Outlook and FAQ
The gold price today is expected to trade between USD 3,950–4,420 tomorrow (AUD 5,695–6,373), maintaining a short-term bearish bias as price action remains beneath the SMA 50 at $4,404.
Is gold currently an effective inflation hedge for Australian investors given domestic CPI and real rates? Yes, provided that rising consumer prices outpace bond yields; however, current data shows the US annual CPI is roughly double Australia’s rate of 2.9%, while the global 10Y Real Rate (TIPS) sits at 2.25%, which offers a lower opportunity cost for holding non-yielding gold than periods when real rates were higher and inflation expectations collapsed.
How do Reserve Bank of Australia policy decisions and US Fed rate paths influence AUD-denominated gold prices? The exchange rate mechanism is decisive here: if the RBA holds its 4.35% rate while the Federal Funds Rate stays near 3.6%, a relatively tighter global stance can keep real yields higher, but any weakening in the Australian dollar due to commodity sentiment or divergent policy will lift local gold prices; conversely, strengthening AUD against USD typically pushes the AUD price down unless geopolitical risks force safe-haven flows.
What are the primary vehicles for buying physical and exchange-traded gold on the ASX? Australian investors can allocate via the Global X Physical Gold ETF (GOLD.AX) or Perth Mint Gold ETF (PMGOLD.AX), while direct ownership is available through Perth Mint bars and Kangaroo coins sourced from established Australian bullion dealers like ABC Bullion.
This article is for informational purposes only and does not constitute investment advice or a financial recommendation. Investing in financial assets involves risk.
Key Takeaways for Traders
- Market Stance and Entry: The market remains bearish as gold trades below all major moving averages with a strong downtrend intact; traders should look for short entries near current levels, targeting lower support zones while waiting for a confirmed reversal above the 50-day average.
- Key Technical Level to Watch: Monitor the $4162.4 resistance level (SMA 20) closely this week, as any decisive break above could temporarily halt the decline toward the major support at $3962.5; confirm momentum shifts using a rising MACD histogram or RSI crossing back above 50 before entering long positions.
- Primary Macro Driver: Keep an eye on US real rates reflected in the TIPS yield of 2.25% and upcoming CPI data, as higher real yields increase the opportunity cost for holding non-yielding gold and exert downward pressure on prices; watch how Fed policy signals interact with these indicators to gauge trend sustainability.
- Flow and Positioning Signal: Note that ETF holdings are showing net outflows of approximately $1.97 billion in USD, indicating institutional investors continue reducing exposure despite some speculative longs building up non-commercially; this divergence suggests caution as retail-driven buying may not offset broad-based selling pressure from funds.
- Main Risk and Hedge Consideration: Geopolitical tensions could trigger temporary spikes driven by safe-haven flows regardless of technical weakness, so use volatility tools like the VIX or options to hedge positions during high-uncertainty periods when oil prices might also influence market sentiment unexpectedly.
